
MATLAB: An Introduction with Applications
6th Edition
ISBN: 9781119256830
Author: Amos Gilat
Publisher: John Wiley & Sons Inc
expand_more
expand_more
format_list_bulleted
Related questions
Question
8
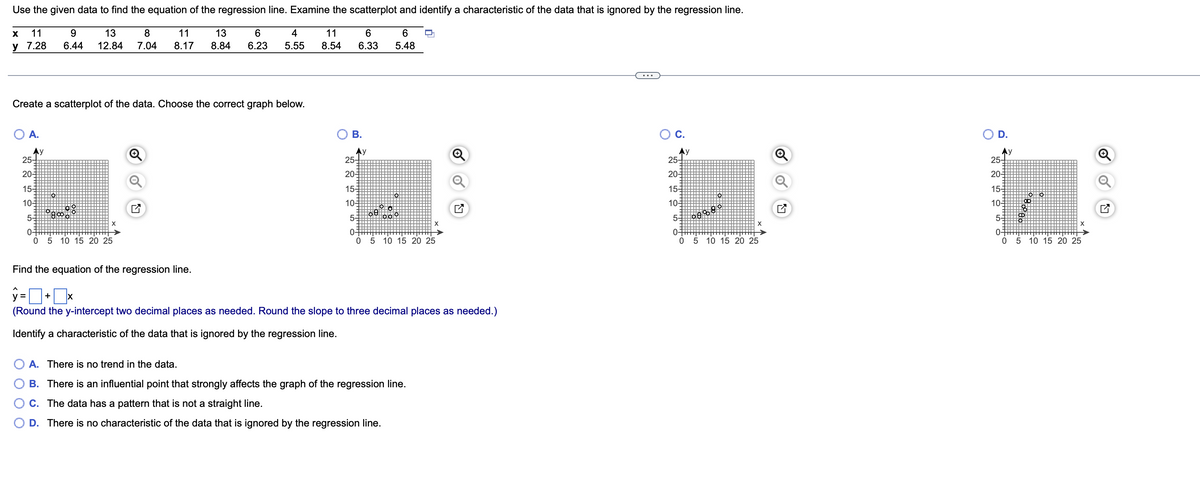

Transcribed Image Text:Use the given data to find the equation of the regression line. Examine the scatterplot and identify a characteristic of the data that is ignored by the regression line.
X
11
9
11
13
6
4
6
13 8
6.44 12.84 7.04 8.17 8.84 6.23 5.55
11
8.54
6
6.33
y 7.28
5.48
Create a scatterplot of the data. Choose the correct graph below.
A.
Ау
25+
20-
15-
10-
to
°8°°°
5-
0-
0 5 10 15 20 25
X
B.
Ay
25+
20-
15-
10-
5-3
0-
0
69
Ho
10¹0¹
5 10 15 20 25
Find the equation of the regression line.
ŷ=+x
(Round the y-intercept two decimal places as needed. Round the slope to three decimal places as needed.)
Identify a characteristic of the data that is ignored by the regression line.
A. There is no trend in the data.
B. There is an influential point that strongly affects the graph of the regression line.
C. The data has a pattern that is not a straight line.
D. There is no characteristic of the data that is ignored by the regression line.
Ау
25+
20-
15-
10-
5-
0-
0
08%99
X
5 10 15 20 25
Q
O D.
25+
20
15-
10-
5
0-
0
y
O
-5
HO
10 15 20 25
Q
Expert Solution
This question has been solved!
Explore an expertly crafted, step-by-step solution for a thorough understanding of key concepts.

Step by stepSolved in 5 steps with 1 images

Knowledge Booster

Similar questions
- 1/20+1/10+1/4arrow_forward-11/16 + 3/4arrow_forwardMATH-112 Section 63 2:00pm Homework: 4.3 Division of Polynom AsS 3 of 10 (7 com Score: 0 of 1 pt 4.3.11 Divide the first polynomial by the second. Siete the quotient and remainder. 2x* - 5x - 4x- - 18x+ 15 x+1 Quotient: remainder: Enter your answer in the edt felds and then click Check Answer All parts showingarrow_forward
arrow_back_ios
arrow_forward_ios
Recommended textbooks for you
- MATLAB: An Introduction with ApplicationsStatisticsISBN:9781119256830Author:Amos GilatPublisher:John Wiley & Sons Inc
 Probability and Statistics for Engineering and th...StatisticsISBN:9781305251809Author:Jay L. DevorePublisher:Cengage Learning
 Statistics for The Behavioral Sciences (MindTap C...StatisticsISBN:9781305504912Author:Frederick J Gravetter, Larry B. WallnauPublisher:Cengage Learning
  Elementary Statistics: Picturing the World (7th E...StatisticsISBN:9780134683416Author:Ron Larson, Betsy FarberPublisher:PEARSON
 The Basic Practice of StatisticsStatisticsISBN:9781319042578Author:David S. Moore, William I. Notz, Michael A. FlignerPublisher:W. H. Freeman
 Introduction to the Practice of StatisticsStatisticsISBN:9781319013387Author:David S. Moore, George P. McCabe, Bruce A. CraigPublisher:W. H. Freeman
MATLAB: An Introduction with Applications
Statistics
ISBN:9781119256830
Author:Amos Gilat
Publisher:John Wiley & Sons Inc
Probability and Statistics for Engineering and th...
Statistics
ISBN:9781305251809
Author:Jay L. Devore
Publisher:Cengage Learning
Statistics for The Behavioral Sciences (MindTap C...
Statistics
ISBN:9781305504912
Author:Frederick J Gravetter, Larry B. Wallnau
Publisher:Cengage Learning
Elementary Statistics: Picturing the World (7th E...
Statistics
ISBN:9780134683416
Author:Ron Larson, Betsy Farber
Publisher:PEARSON
The Basic Practice of Statistics
Statistics
ISBN:9781319042578
Author:David S. Moore, William I. Notz, Michael A. Fligner
Publisher:W. H. Freeman
Introduction to the Practice of Statistics
Statistics
ISBN:9781319013387
Author:David S. Moore, George P. McCabe, Bruce A. Craig
Publisher:W. H. Freeman