MATLAB: An Introduction with Applications
6th Edition
ISBN: 9781119256830
Author: Amos Gilat
Publisher: John Wiley & Sons Inc
expand_more
expand_more
format_list_bulleted
Question

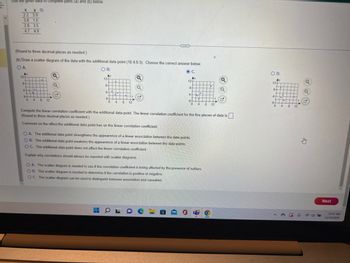
Transcribed Image Text:Use the given data to complete parts (a) and (b) below.
X yo
2.2 3.9
3.8 1.5
2.8 3.5
4.7 4.9
(Round to three decimal places as needed.)
(b) Draw a scatter diagram of the data with the additional data point (10.4.9.3). Choose the correct answer below.
O A.
Ay
124
8-
4-
0-
0
30 1.
C
4 8 12
Q
Q
M
O B.
Ay
12+
8-
4-
0-
0 4
8 12
***
E
OL
O C.
Ay
12-
8-
4
0-
OA. The additional data point strengthens the appearence of a linear association between the data points.
OB. The additional data point weakens the appearence of a linear association between the data points.
OC. The additional data point does not affect the linear correlation coefficient.
Explain why correlations should always be reported with scatter diagrams.
O
Pa
.
4 8 12
Compute the linear correlation coefficient with the additional data point. The linear correlation coefficient for the five pieces of data is.
(Round to three decimal places as needed.)
Comment on the effect the additional data point has on the linear correlation coefficient.
OA. The scatter diagram is needed to see if the correlation coefficient is being affected by the presence of outliers.
OB. The scatter diagram is needed to determine if the correlation is positive or negative.
OC. The scatter diagram can be used to distinguish between association and causation.
Q
6
G
O D.
Ay
of Igº Ñ.
124
4
0-
0
THU
+++++.
·
+++
4
4 8 12
Q
P
Next
12:47 PM
12/23/2022

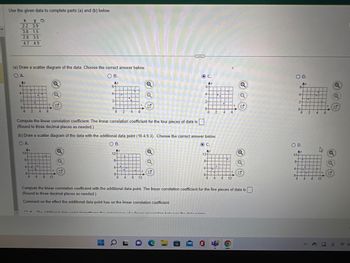
Transcribed Image Text:Use the given data to complete parts (a) and (b) below.
X
ya
2.2 3.9
3.8 1.5
2.8 3.5
4.7 4.9
(a) Draw a scatter diagram of the data. Choose the correct answer below.
O A.
O B.
Ay
Ay
6-
4
2
•HTT
0+
0
LE
H
Ay
12-
8-
4.
.
0
I
L
T
2 4 6
.
Q
Compute the linear correlation coefficient. The linear correlation coefficient for the four pieces of data is
(Round to three decimal places as needed.).
HE
4 8 12
6-
Q
4-
2-
0-
▬
THE
(b) Draw a scatter diagram of the data with the additional data point (10.4.9.3). Choose the correct answer below.
O A.
O B.
Ay
12-
8-
4-
.
Q
0+
0 4 8 12
Q
Q
ON The additional data naint strannthamn the anaAR. of a linnar nonnaintian hahus
OL
OC.
Ау
6
4-
2-
0-
O C.
Aу
0
124
8-
4
0-
naintian hahunan the data nainta
2
•
4
0 4 8
Compute the linear correlation coefficient with the additional data point. The linear correlation coefficient for the five pieces of data is
(Round to three decimal places as needed.)
Comment on the effect the additional data point has on the linear correlation coefficient.
6
Q
Q
Q
O D.
Ay
12-
8-
4.
6
4-
2-
0-
O D.
Ay
||||
0-
3++
1.
0
1||||||
2
▪
0 4 8
1
4
4
|||||||o
||||||
12
Q
Q
Q
Expert Solution
This question has been solved!
Explore an expertly crafted, step-by-step solution for a thorough understanding of key concepts.
This is a popular solution
Trending nowThis is a popular solution!
Step by stepSolved in 5 steps with 2 images

Knowledge Booster
Similar questions
- Use the given data to complete parts (a) and (b) below. 薑 y 2.2 3.8 4 1.5 2.9 3.7 4.6 4.9 (a) Draw a scatter diagram of the data. Choose the correct answer below. OA. B. OD. AY 6- Ay 6- 6- Ay 64 4- 4- 4- 4- 2- 2- 2- 2- 0- 0- 0- 4 Compute the linear correlation coefficient. The linear correlation coefficient for the four pieces of data is (Round to three decimal places as needed.)arrow_forwardUsing the given data, find the following. , 1.4, 5.9, 8.3, 15.2, 13.4, 11.8, 17.316.2 Identify the five-number summary. Round your answers to one decimal place as needed. Low =, Q1= MD= Q3= High=arrow_forwardCalculate the five-number summary of the given data. Use the approximation method. Enter your answer in ascending order, separating each answer with a comma. 1, 19, 14, 3, 17, 21, 10, 12, 10, 16, 11,9, 22, 19,9 Answer Keypad Keyboard Shortcuts Tablesarrow_forward
- Consider these data: 5.52, 5.96, 5.87, 6.04, 6.01, 5.79, 5.84, 5.59, 5.99, 5.66, 5.81, 5.46, 5.92, 5.80, 5.95 Which box plot best represents these data? 5.4 5.5 5.6 5.7 5.8 5.9 6 6.1 6.2 © 2020 Strong Mind. Created using GeoGebra. 5.4 5.5 5.6 5.7 5.8 5.9 6 6.1 6.2 © 2020 StrongMind. Created using GeoGebra. 5.4 5.5 5.6 5.7 5.8 5.9 6 6.1 6.2 2020 StrongMind. Created using GeoGebra. 5.4 5.5 5.6 5.7 5.8 5.9 6 6.1 6.2 © 2020 StrongMind. Created using GeoGebra.arrow_forwardThe data to the right represent the number of chocolate chips per cookie in a random sample of a name brand and a store brand. Complete parts (a) to (c) below.. 10 N (a) Draw side-by-side boxplots for each brand of cookie. Label the boxplots "N" for the name brand and "S" for the store brand. Choose the correct answer below. OA. OB. O C. C N I 10 on he Full data set Name Brand Store Brand 26 23 32 28 33 15 29 22 31 21 17 27 23 35 25 28 19 26 23 22 28 24 24 24 22 28 +arrow_forwardAssitance with the following please. Using the information given in the image. c. Compare the variation in the number of driving citations and the annual income. Explain why you choose this method to compare the variations?arrow_forward
- Help with MD and Interquartile.arrow_forwardThe data to the right represent the number of chocolate chips per cookie in a random sample of a name brand and a store brand. Complete parts (a) to (c) below. (a) Draw side-by-side boxplots for each brand of cookie. Label the boxplots "N" for the name brand and "S" for the store brand Choose the correct answer below. O A. OB. O C. O D. S 10 N- 20 30 40 Q 17 S N- 10 20 30 40 9.1 ✔ N- 27 S- 10 20 30 40 Q N- ام 10 20 30 Name Brand 20 22 25 27 30 20 29 33 21 Full data set D Store Brand 24 23 21 27 19 26 24 33 15 23 22 26 22 28 17 25 28 40 Garrow_forwardPlease help on parts f, g, and h (subpart 3)arrow_forward
arrow_back_ios
SEE MORE QUESTIONS
arrow_forward_ios
Recommended textbooks for you
 MATLAB: An Introduction with ApplicationsStatisticsISBN:9781119256830Author:Amos GilatPublisher:John Wiley & Sons Inc
 Probability and Statistics for Engineering and th...StatisticsISBN:9781305251809Author:Jay L. DevorePublisher:Cengage Learning
 Statistics for The Behavioral Sciences (MindTap C...StatisticsISBN:9781305504912Author:Frederick J Gravetter, Larry B. WallnauPublisher:Cengage Learning
 Elementary Statistics: Picturing the World (7th E...StatisticsISBN:9780134683416Author:Ron Larson, Betsy FarberPublisher:PEARSON
 The Basic Practice of StatisticsStatisticsISBN:9781319042578Author:David S. Moore, William I. Notz, Michael A. FlignerPublisher:W. H. Freeman
 Introduction to the Practice of StatisticsStatisticsISBN:9781319013387Author:David S. Moore, George P. McCabe, Bruce A. CraigPublisher:W. H. Freeman

MATLAB: An Introduction with Applications
Statistics
ISBN:9781119256830
Author:Amos Gilat
Publisher:John Wiley & Sons Inc

Probability and Statistics for Engineering and th...
Statistics
ISBN:9781305251809
Author:Jay L. Devore
Publisher:Cengage Learning

Statistics for The Behavioral Sciences (MindTap C...
Statistics
ISBN:9781305504912
Author:Frederick J Gravetter, Larry B. Wallnau
Publisher:Cengage Learning

Elementary Statistics: Picturing the World (7th E...
Statistics
ISBN:9780134683416
Author:Ron Larson, Betsy Farber
Publisher:PEARSON

The Basic Practice of Statistics
Statistics
ISBN:9781319042578
Author:David S. Moore, William I. Notz, Michael A. Fligner
Publisher:W. H. Freeman

Introduction to the Practice of Statistics
Statistics
ISBN:9781319013387
Author:David S. Moore, George P. McCabe, Bruce A. Craig
Publisher:W. H. Freeman