Essentials Of Investments
11th Edition
ISBN: 9781260013924
Author: Bodie, Zvi, Kane, Alex, MARCUS, Alan J.
Publisher: Mcgraw-hill Education,
expand_more
expand_more
format_list_bulleted
Question

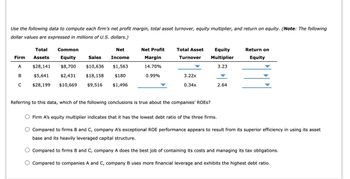
Transcribed Image Text:Use the following data to compute each firm's net profit margin, total asset turnover, equity multiplier, and return on equity. (Note: The following
dollar values are expressed in millions of U.S. dollars.)
Common
Equity
$8,700 $10,636 $1,563
$28,141
B
$5,641
$2,431 $18,158 $180
C $28,199 $10,669 $9,516 $1,496
Firm
A
Total
Assets
Net
Sales Income
Net Profit
Margin
14.70%
0.99%
Total Asset
Turnover
3.22x
0.34x
Referring to this data, which of the following conclusions is true about the companies' ROES?
Equity
Multiplier
3.23
2.64
Return on
Equity
Firm A's equity multiplier indicates that it has the lowest debt ratio of the three firms.
Compared to firms B and C, company A's exceptional ROE performance appears to result from its superior efficiency in using its asset
base and its heavily leveraged capital structure.
Compared to firms B and C, company A does the best job of containing its costs and managing its tax obligations.
Compared to companies A and C, company B uses more financial leverage and exhibits the highest debt ratio.
Expert Solution
arrow_forward
Step 1
A mathematical relationship between two variables is a ratio analysis. Investors use this analysis to gauge a company's financial performance.
Trending nowThis is a popular solution!
Step by stepSolved in 2 steps with 3 images

Knowledge Booster
Similar questions
- Please helparrow_forwardCalculate the Weighted Average Cost of Capital (WACC) Cost of Equity = 11.02% Cost of Debt = 5.35% Debt-to-Equity Ratio = 15.52%arrow_forwardBased on the following information, what is the firm's weighted average cost of capital of the operating assets, WACCO? Cost of debt, RD: 7% Cost of equity, Rs: 20% Total market value of debt, D: 500 Total market value of equity, S: 1,500 Number of common shares outstanding: 100 Total market value of non-operating assets, N: 200 Cost of non-operating assets, RN: 9% Corporate tax rate, T: 40% O .143009 b. 168751 a. c. .188232 d. .127767arrow_forward
- If a bank has the following ratios, it can pay up to of its earnings as dividends. Tier 1 leverage = 4.7% Tier 1 common equity risk-based = 7.2% %3D Tier 1 risk-based 8.3% Total capital risk-based = 11%arrow_forwardLoreto Inc. has the following financial ratios: asset turnover = 2.40; net profit margin (i.e., net income/sales) = 5%; payout ratio = 30%; equity/assets = 0.40. a. What is Loreto's sustainable growth rate? b. What is its internal growth rate?arrow_forwardBased on the following information, calculate the sustainable growth rate for Kaleb's Heavy Equipment: Profit margin Capital intensity ratio Debt-equity ratio Net income Dividends 8.1% .51 .67 $ 29,000 $19,720arrow_forward
- The calculation of WACC involves calculating the weighted average of the required rates of return on debt, preferred stock, and common equity, where the weights equal the percentage of each type of financing in the firm’s overall capital structure. Q1. ________is the symbol that represents the cost of preferred stock in the weighted average cost of capital (WACC) equation. Q2. Avery Co. has $3.9 million of debt, $2 million of preferred stock, and $2.2 million of common equity. What would be its weight on debt? a. 0.27 b. 0.25 c. 0.48 d. 0.20 Q1. Option 1 rS or Option 2 rD or Option 3 rP or Option 4 rE Please provide the correct answers. Thank you!arrow_forwardProblem solve this problemarrow_forward
arrow_back_ios
arrow_forward_ios
Recommended textbooks for you
 Essentials Of InvestmentsFinanceISBN:9781260013924Author:Bodie, Zvi, Kane, Alex, MARCUS, Alan J.Publisher:Mcgraw-hill Education,

 Foundations Of FinanceFinanceISBN:9780134897264Author:KEOWN, Arthur J., Martin, John D., PETTY, J. WilliamPublisher:Pearson,
 Fundamentals of Financial Management (MindTap Cou...FinanceISBN:9781337395250Author:Eugene F. Brigham, Joel F. HoustonPublisher:Cengage Learning
 Corporate Finance (The Mcgraw-hill/Irwin Series i...FinanceISBN:9780077861759Author:Stephen A. Ross Franco Modigliani Professor of Financial Economics Professor, Randolph W Westerfield Robert R. Dockson Deans Chair in Bus. Admin., Jeffrey Jaffe, Bradford D Jordan ProfessorPublisher:McGraw-Hill Education

Essentials Of Investments
Finance
ISBN:9781260013924
Author:Bodie, Zvi, Kane, Alex, MARCUS, Alan J.
Publisher:Mcgraw-hill Education,


Foundations Of Finance
Finance
ISBN:9780134897264
Author:KEOWN, Arthur J., Martin, John D., PETTY, J. William
Publisher:Pearson,

Fundamentals of Financial Management (MindTap Cou...
Finance
ISBN:9781337395250
Author:Eugene F. Brigham, Joel F. Houston
Publisher:Cengage Learning

Corporate Finance (The Mcgraw-hill/Irwin Series i...
Finance
ISBN:9780077861759
Author:Stephen A. Ross Franco Modigliani Professor of Financial Economics Professor, Randolph W Westerfield Robert R. Dockson Deans Chair in Bus. Admin., Jeffrey Jaffe, Bradford D Jordan Professor
Publisher:McGraw-Hill Education