
MATLAB: An Introduction with Applications
6th Edition
ISBN: 9781119256830
Author: Amos Gilat
Publisher: John Wiley & Sons Inc
expand_more
expand_more
format_list_bulleted
Related questions
Question
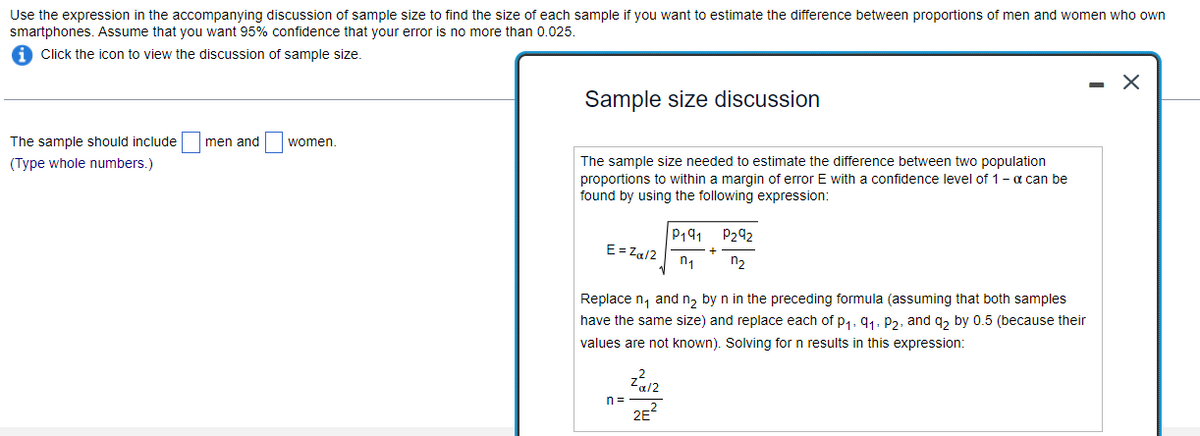

Transcribed Image Text:Use the expression in the accompanying discussion of sample size to find the size of each sample if you want to estimate the difference between proportions of men and women who own
smartphones. Assume that you want 95% confidence that your error is no more than 0.025.
Click the icon to view the discussion of sample size.
The sample should include
(Type whole numbers.)
men and
women.
Sample size discussion
The sample size needed to estimate the difference between two population
proportions to within a margin of error E with a confidence level of 1 - a can be
found by using the following expression:
E=Zα/2
n=
P191
n₁
Replace n₁ and n₂ by n in the preceding formula (assuming that both samples
have the same size) and replace each of P₁, 9₁, P2, and q2 by 0.5 (because their
values are not known). Solving for n results in this expression:
Zα/2
2E²
P292
n₂
X
Expert Solution
This question has been solved!
Explore an expertly crafted, step-by-step solution for a thorough understanding of key concepts.

This is a popular solution

Trending nowThis is a popular solution!

Step by stepSolved in 2 steps with 1 images

Knowledge Booster

Similar questions
- State whether one would expect the data set described below to be normally distributed. Explain why or why not. The genders of 1,000 randomly selected adultsarrow_forwardHelp with #14 pleasearrow_forwardA simple data set has been provided to practice the basics of finding measures of variation. 2, 4, 8, 8 For the data set, determine the range and the sample standard deviation.arrow_forward
- Determine whether the data described below are qualitative or quantitative and explain why. The numbers of students in the graduating class at different high schools F4 Choose the correct answer below. O A. The data are quantitative because they consist of counts or measurements. OB. The data are quantitative because they don't measure or count anything. OC. The data are qualitative because they consist of counts or measurements. OD. The data are qualitative because they don't measure or count anything. KA $ 4 R F5 % 5 F6 T A 6 F7 V F8 & 7 11 DELL F9 * 00 8 F10 13 9 F11 O F12 PrtScr 3arrow_forwardWe have provided simple data sets for you to practice the basics of finding a a. population mean. b. population standard deviation. 3, 5, 7arrow_forwardGiven the 1st and 3rd quartiles of a data are 24 and 48, respectively, what value would be considered an outlier? A 83 B D 88 72 Can't tell.arrow_forward
- In Exercise, we have provided simple data sets for you to practice the basics of finding measures of variation. For each data set, determine the a.range.b.sample standard deviation. 3, 5, 7arrow_forwardIn Exercise, we have provided simple data sets for you to practice the basics of finding measures of variation. For each data set, determine the a.range.b.sample standard deviation. 4, 0, 5arrow_forwardplease provide CORRECT answers! Thank you.arrow_forward
arrow_back_ios
arrow_forward_ios
Recommended textbooks for you
- MATLAB: An Introduction with ApplicationsStatisticsISBN:9781119256830Author:Amos GilatPublisher:John Wiley & Sons Inc
 Probability and Statistics for Engineering and th...StatisticsISBN:9781305251809Author:Jay L. DevorePublisher:Cengage Learning
 Statistics for The Behavioral Sciences (MindTap C...StatisticsISBN:9781305504912Author:Frederick J Gravetter, Larry B. WallnauPublisher:Cengage Learning
  Elementary Statistics: Picturing the World (7th E...StatisticsISBN:9780134683416Author:Ron Larson, Betsy FarberPublisher:PEARSON
 The Basic Practice of StatisticsStatisticsISBN:9781319042578Author:David S. Moore, William I. Notz, Michael A. FlignerPublisher:W. H. Freeman
 Introduction to the Practice of StatisticsStatisticsISBN:9781319013387Author:David S. Moore, George P. McCabe, Bruce A. CraigPublisher:W. H. Freeman
MATLAB: An Introduction with Applications
Statistics
ISBN:9781119256830
Author:Amos Gilat
Publisher:John Wiley & Sons Inc
Probability and Statistics for Engineering and th...
Statistics
ISBN:9781305251809
Author:Jay L. Devore
Publisher:Cengage Learning
Statistics for The Behavioral Sciences (MindTap C...
Statistics
ISBN:9781305504912
Author:Frederick J Gravetter, Larry B. Wallnau
Publisher:Cengage Learning
Elementary Statistics: Picturing the World (7th E...
Statistics
ISBN:9780134683416
Author:Ron Larson, Betsy Farber
Publisher:PEARSON
The Basic Practice of Statistics
Statistics
ISBN:9781319042578
Author:David S. Moore, William I. Notz, Michael A. Fligner
Publisher:W. H. Freeman
Introduction to the Practice of Statistics
Statistics
ISBN:9781319013387
Author:David S. Moore, George P. McCabe, Bruce A. Craig
Publisher:W. H. Freeman