
Essentials Of Investments
11th Edition
ISBN: 9781260013924
Author: Bodie, Zvi, Kane, Alex, MARCUS, Alan J.
Publisher: Mcgraw-hill Education,
expand_more
expand_more
format_list_bulleted
Related questions
Question
Bhupatbhai
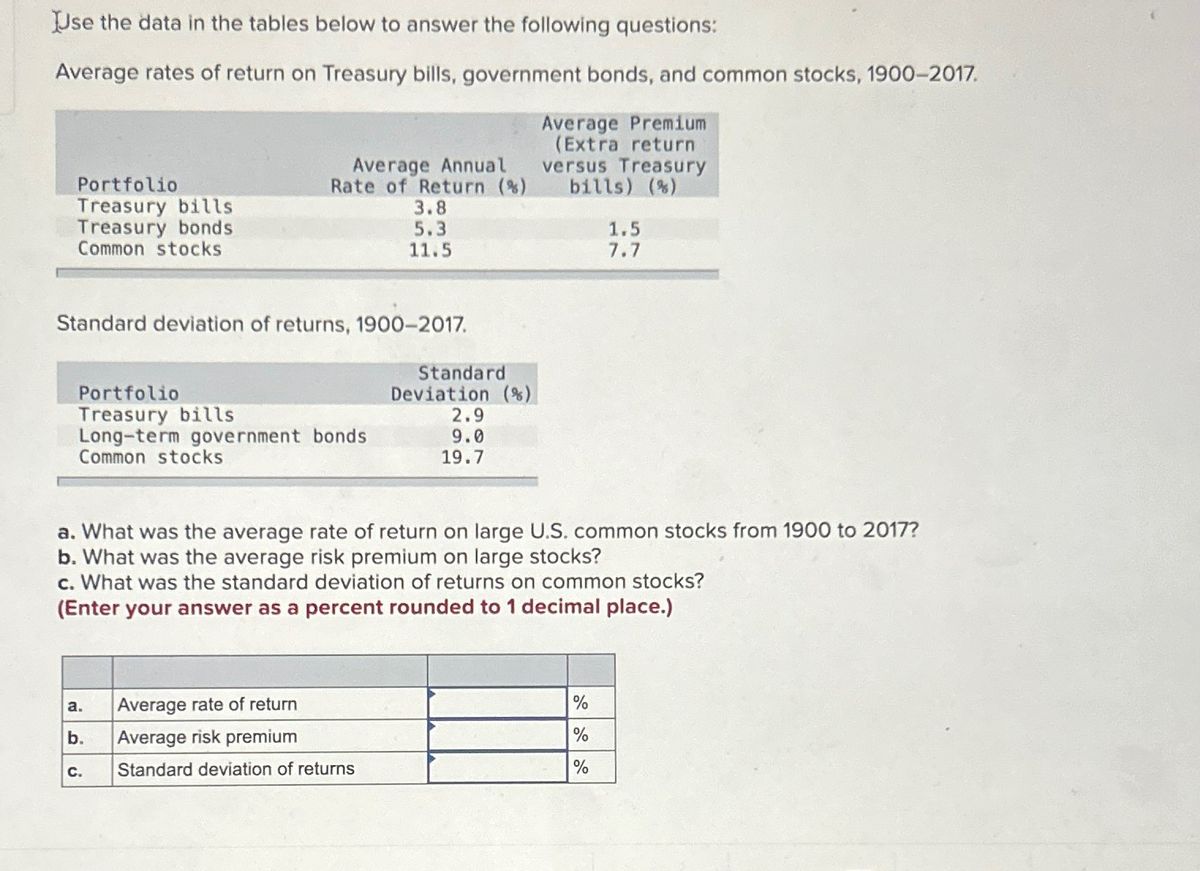

Transcribed Image Text:Use the data in the tables below to answer the following questions:
Average rates of return on Treasury bills, government bonds, and common stocks, 1900-2017.
Portfolio
Treasury bills
Treasury bonds
Common stocks
Average Annual
Rate of Return (%)
3.8
5.3
11.5
Average Premium
(Extra return
versus Treasury
bills) (%)
1.5
7.7
Standard deviation of returns, 1900-2017.
Standard
Portfolio
Deviation (%)
Treasury bills
2.9
Long-term government bonds
9.0
Common stocks
19.7
a. What was the average rate of return on large U.S. common stocks from 1900 to 2017?
b. What was the average risk premium on large stocks?
c. What was the standard deviation of returns on common stocks?
(Enter your answer as a percent rounded to 1 decimal place.)
a.
Average rate of return
%
b.
Average risk premium
%
C.
Standard deviation of returns
%
Expert Solution
This question has been solved!
Explore an expertly crafted, step-by-step solution for a thorough understanding of key concepts.

Step by stepSolved in 2 steps

Knowledge Booster

Similar questions
- An expected social behavior from members of a society is called Oa. Norms O b. Information O C. Attitude O d. Behaviourarrow_forward48:2 Which statement best explains why Mr. Whymper serves as an intermediary for Animal Farm? ad ith O He is motivated by a desire for power. He is motivated by financial success. O He is motivated by a sense of duty. He is motivated by a desire to help others. lier a Save and Exitarrow_forwardWhat is the meaning of Intestate?arrow_forward
arrow_back_ios
SEE MORE QUESTIONS
arrow_forward_ios
Recommended textbooks for you
- Essentials Of InvestmentsFinanceISBN:9781260013924Author:Bodie, Zvi, Kane, Alex, MARCUS, Alan J.Publisher:Mcgraw-hill Education,


 Foundations Of FinanceFinanceISBN:9780134897264Author:KEOWN, Arthur J., Martin, John D., PETTY, J. WilliamPublisher:Pearson,
 Fundamentals of Financial Management (MindTap Cou...FinanceISBN:9781337395250Author:Eugene F. Brigham, Joel F. HoustonPublisher:Cengage Learning
 Corporate Finance (The Mcgraw-hill/Irwin Series i...FinanceISBN:9780077861759Author:Stephen A. Ross Franco Modigliani Professor of Financial Economics Professor, Randolph W Westerfield Robert R. Dockson Deans Chair in Bus. Admin., Jeffrey Jaffe, Bradford D Jordan ProfessorPublisher:McGraw-Hill Education
Essentials Of Investments
Finance
ISBN:9781260013924
Author:Bodie, Zvi, Kane, Alex, MARCUS, Alan J.
Publisher:Mcgraw-hill Education,
Foundations Of Finance
Finance
ISBN:9780134897264
Author:KEOWN, Arthur J., Martin, John D., PETTY, J. William
Publisher:Pearson,
Fundamentals of Financial Management (MindTap Cou...
Finance
ISBN:9781337395250
Author:Eugene F. Brigham, Joel F. Houston
Publisher:Cengage Learning
Corporate Finance (The Mcgraw-hill/Irwin Series i...
Finance
ISBN:9780077861759
Author:Stephen A. Ross Franco Modigliani Professor of Financial Economics Professor, Randolph W Westerfield Robert R. Dockson Deans Chair in Bus. Admin., Jeffrey Jaffe, Bradford D Jordan Professor
Publisher:McGraw-Hill Education