
MATLAB: An Introduction with Applications
6th Edition
ISBN: 9781119256830
Author: Amos Gilat
Publisher: John Wiley & Sons Inc
expand_more
expand_more
format_list_bulleted
Related questions
Topic Video
Question
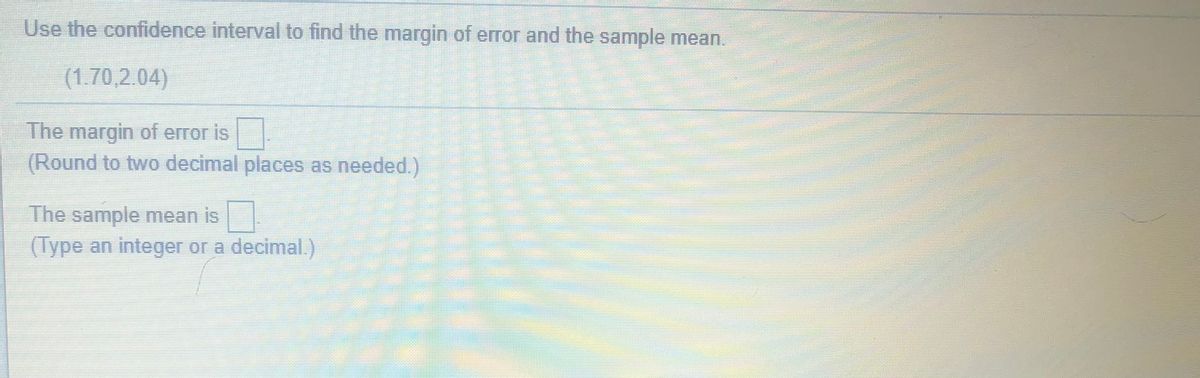

Transcribed Image Text:Use the confidence interval to find the margin of error and the sample mean.
(1.70,2.04)
The margin of error is
(Round to two decimal places as needed.)
The sample mean is
(Type an integer or a decimal.)
Expert Solution
This question has been solved!
Explore an expertly crafted, step-by-step solution for a thorough understanding of key concepts.

This is a popular solution

Trending nowThis is a popular solution!

Step by stepSolved in 3 steps with 2 images

Knowledge Booster


Learn more about
Need a deep-dive on the concept behind this application? Look no further. Learn more about this topic, statistics and related others by exploring similar questions and additional content below.Similar questions
- Use the expression in the accompanying discussion of sample size to find the size of each sample if you want to estimate the difference between proportions of men and women who own smartphones. Assume that you want 90% confidence that your error is no more than 0.035. A Click the icon to view the discussion of sample size. The sample should include men and women. (Type whole numbers.)arrow_forwardFind the mean, the median, and the mode(s), if any, for the given data. Round noninteger means to the nearest tenth. (If there is more than one mode, enter your answer as a comma-separated list. If an answer does not exist, enter DNE.) −8.5, −2.4, 4.7, 4.7, 6.4, 8.9, 9.9arrow_forwardDetermine whether the statement is true or false. If it is false, rewrite it as a true statement. As the size of a sample increases, the mean of the distribution of sample means increases. Choose the correct answer below. O A. False. As the size of a sample increases, the mean of the distribution of sample means decreases. B. False. As the size of a sample increases, the mean of the distribution of sample means does not change. O C. True.arrow_forward
- Find the margin of error for the given values of c, s, and n. c= 0.99, s= 2.7, n = 12 Click the icon to view the t-distribution table. The margin of error is . (Round to one decimal place as needed.)arrow_forwardCalculate the standard score (z-score) of the given sample mean. Round your answer to two decimal places. u = 23 and o = 7; n = 72; ī = 22arrow_forwardUse the standard normal table to find the z-score that corresponds to the given percentile. If the area is not in the table, use the entry closest to the area. If the area is halfway between two entries use the z-score halfway between the corresponding z-scores. If convenient, use technology to find the z-score. P 25 Click to view page 1 of the table. Click to view page 2 of the table. The z-score that corresponds to P25 is (Round to two decimal places as needed.)arrow_forward
- Use the dataset below to fill in the blanks. The space between the data and the blanks isprovided so that you can show each data value's deviation and each data value's deviation squared.Sixteen families were selected at random and the number of children in each was recorded 0 0 0 1 1 2 2 2 2 2 3 3 4 6 8 12arrow_forwardUse the standard normal table to find the z-score that corresponds to the given percentile. If the area is not in the table, use the entry closest to the area. If the area is halfway between two entries, use the z-score halfway between the corresponding z-scores. If convenient, use technology to find the z-score. P 48 Click to view page 1 of the table. Click to view page 2 of the table. The Z-score that corresponds to P48 is (Round to two decimal places as needed.)arrow_forward
arrow_back_ios
arrow_forward_ios
Recommended textbooks for you
- MATLAB: An Introduction with ApplicationsStatisticsISBN:9781119256830Author:Amos GilatPublisher:John Wiley & Sons Inc
 Probability and Statistics for Engineering and th...StatisticsISBN:9781305251809Author:Jay L. DevorePublisher:Cengage Learning
 Statistics for The Behavioral Sciences (MindTap C...StatisticsISBN:9781305504912Author:Frederick J Gravetter, Larry B. WallnauPublisher:Cengage Learning
  Elementary Statistics: Picturing the World (7th E...StatisticsISBN:9780134683416Author:Ron Larson, Betsy FarberPublisher:PEARSON
 The Basic Practice of StatisticsStatisticsISBN:9781319042578Author:David S. Moore, William I. Notz, Michael A. FlignerPublisher:W. H. Freeman
 Introduction to the Practice of StatisticsStatisticsISBN:9781319013387Author:David S. Moore, George P. McCabe, Bruce A. CraigPublisher:W. H. Freeman
MATLAB: An Introduction with Applications
Statistics
ISBN:9781119256830
Author:Amos Gilat
Publisher:John Wiley & Sons Inc
Probability and Statistics for Engineering and th...
Statistics
ISBN:9781305251809
Author:Jay L. Devore
Publisher:Cengage Learning
Statistics for The Behavioral Sciences (MindTap C...
Statistics
ISBN:9781305504912
Author:Frederick J Gravetter, Larry B. Wallnau
Publisher:Cengage Learning
Elementary Statistics: Picturing the World (7th E...
Statistics
ISBN:9780134683416
Author:Ron Larson, Betsy Farber
Publisher:PEARSON
The Basic Practice of Statistics
Statistics
ISBN:9781319042578
Author:David S. Moore, William I. Notz, Michael A. Fligner
Publisher:W. H. Freeman
Introduction to the Practice of Statistics
Statistics
ISBN:9781319013387
Author:David S. Moore, George P. McCabe, Bruce A. Craig
Publisher:W. H. Freeman