
MATLAB: An Introduction with Applications
6th Edition
ISBN: 9781119256830
Author: Amos Gilat
Publisher: John Wiley & Sons Inc
expand_more
expand_more
format_list_bulleted
Related questions
Question
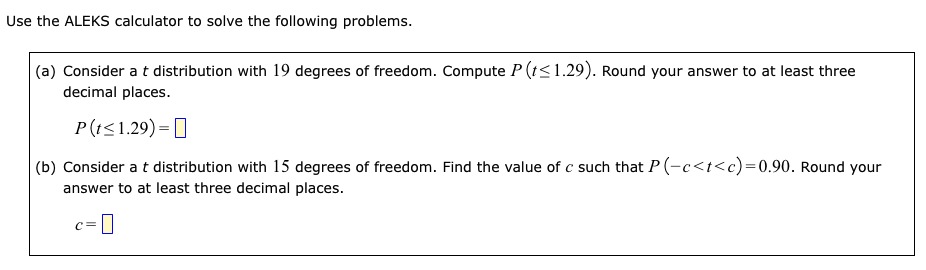

Transcribed Image Text:Use the ALEKS calculator to solve the following problems.
(a) Consider at distribution with 19 degrees of freedom. Compute P (t≤1.29). Round your answer to at least three
decimal places.
P(t≤1.29)=
(b) Consider a t distribution with 15 degrees of freedom. Find the value of c such that P(-c<t<c)=0.90. Round your
answer to at least three decimal places.
C=
Expert Solution
This question has been solved!
Explore an expertly crafted, step-by-step solution for a thorough understanding of key concepts.

Step by stepSolved in 2 steps

Knowledge Booster

Similar questions
- 1 b) For any data set, approximately 95% of the observations fall in the interval (T − 2s, T+2s). True Falsearrow_forwardThe state of California has a mean annual rainfall of 22 inches, whereas the state of New York has a mean annual rainfall of 42 inches. Assume that the standard deviation for both states is 3 inches. A sample of 30 years of rainfall for California and a sample of 45 years of rainfall for New York has been taken. If required, round your answer to three decimal places. (a) Show the sampling distribution of the sample mean annual rainfall for California. E(x) σx̄ California inches inches (b) Show the sampling distribution of the sample mean annual rainfall for New York. E(x) σx̄ New York inches inches (c) In which of the preceding two cases, part (a) or part (b), is the standard error of x smaller? Why? The standard error is - Select your answer -largersmallerItem 5 for New York because the sample size is - Select your answer -largersmallerItem 6 than for California.arrow_forwardQ23. A social psychologist records the number of outbursts in a sample of different classrooms at a local school. Answer the questions based on the statement below. (Note: These are not the results from Q19) The number of outbursts among students at this local school (M = 3) was significantly less than that in the general population, t(39) = 4.19, p < .05, d = .25. 23a. What was the sample size?n = 23b. What was the decision?A. Retain H0B. Reject H0Decision = 23c. What was the effect size?A. 39B. 4.19C. .05D. .25 Effect size =arrow_forward
- Suppose that scores on a particular test are normally distributed with a mean of 140 and a standard deviation of 18. What is the minimum score needed to be in the top 10% of the scores on the test? Carry your intermedlate computations to.at least four decimal places, and round your answer to one decimal place. Continue ace esc & # 24 @ 7 4 2 t y r earrow_forwardStoaches are fictional creatures, sometimes mistaken for mome raths. Suppose a two-tailed t-test is conducted to test for a difference between the population means of adult female stoach weights and adult male stoach weights. The female sample has 13 weights, and the male sample has 7 weights. The t-statistic for the test is -0.20542. What is the p-value? (Give your answer to 4 decimal places.) p-value:arrow_forwardt has been suggested that gossiping about others may affect how likeable you are. Two groups of participants are asked to read a vignette describing a fictional person. They are then asked to rate how much they would like the person described in the vignette on a continuous scale from 1-15, where higher scores represent a higher likability. The first group of participants (n=20) reads a vignette describing a person that frequently gossips and obtains an average likability score of (M1) with a variance of (S12). The second group of different participants (n=20) reads a vignette describing a person that never gossips and obtains an average likability score of (M2) with a variance of (S22). Given that there is not much research in this area, test the hypothesis that gossiping impacts likability at an alpha=0.05. 1, Are the results you obtained meaningful? report the results here for your effect size showing all your work and your interpretation 2. Report the results of the study…arrow_forward
arrow_back_ios
arrow_forward_ios
Recommended textbooks for you
- MATLAB: An Introduction with ApplicationsStatisticsISBN:9781119256830Author:Amos GilatPublisher:John Wiley & Sons Inc
 Probability and Statistics for Engineering and th...StatisticsISBN:9781305251809Author:Jay L. DevorePublisher:Cengage Learning
 Statistics for The Behavioral Sciences (MindTap C...StatisticsISBN:9781305504912Author:Frederick J Gravetter, Larry B. WallnauPublisher:Cengage Learning
  Elementary Statistics: Picturing the World (7th E...StatisticsISBN:9780134683416Author:Ron Larson, Betsy FarberPublisher:PEARSON
 The Basic Practice of StatisticsStatisticsISBN:9781319042578Author:David S. Moore, William I. Notz, Michael A. FlignerPublisher:W. H. Freeman
 Introduction to the Practice of StatisticsStatisticsISBN:9781319013387Author:David S. Moore, George P. McCabe, Bruce A. CraigPublisher:W. H. Freeman
MATLAB: An Introduction with Applications
Statistics
ISBN:9781119256830
Author:Amos Gilat
Publisher:John Wiley & Sons Inc
Probability and Statistics for Engineering and th...
Statistics
ISBN:9781305251809
Author:Jay L. Devore
Publisher:Cengage Learning
Statistics for The Behavioral Sciences (MindTap C...
Statistics
ISBN:9781305504912
Author:Frederick J Gravetter, Larry B. Wallnau
Publisher:Cengage Learning
Elementary Statistics: Picturing the World (7th E...
Statistics
ISBN:9780134683416
Author:Ron Larson, Betsy Farber
Publisher:PEARSON
The Basic Practice of Statistics
Statistics
ISBN:9781319042578
Author:David S. Moore, William I. Notz, Michael A. Fligner
Publisher:W. H. Freeman
Introduction to the Practice of Statistics
Statistics
ISBN:9781319013387
Author:David S. Moore, George P. McCabe, Bruce A. Craig
Publisher:W. H. Freeman