
MATLAB: An Introduction with Applications
6th Edition
ISBN: 9781119256830
Author: Amos Gilat
Publisher: John Wiley & Sons Inc
expand_more
expand_more
format_list_bulleted
Related questions
Question
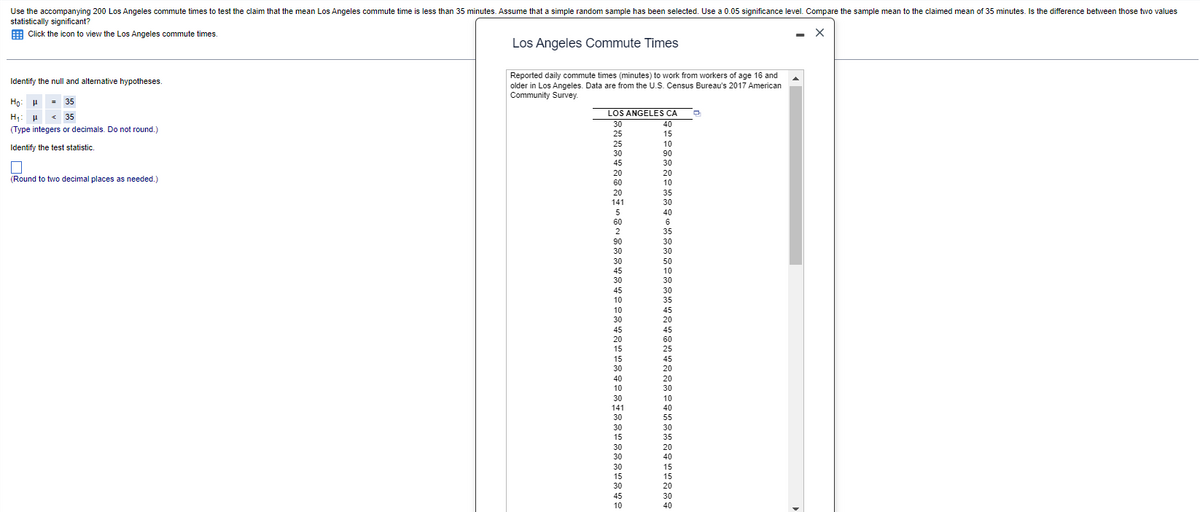

Transcribed Image Text:**Educational Website Content on Hypothesis Testing: Los Angeles Commute Times**
---
**Purpose:**
This exercise aims to test the claim that the mean commute time for workers in Los Angeles is less than 35 minutes. A random sample of 200 commute times is analyzed using a 0.05 significance level. The task is to evaluate if the sample mean significantly differs from the claimed population mean of 35 minutes.
**Steps:**
1. **Identify the Hypotheses:**
- **Null Hypothesis (H₀):** μ = 35
(The mean commute time is 35 minutes.)
- **Alternative Hypothesis (H₁):** μ < 35
(The mean commute time is less than 35 minutes.)
- **Input:** Type integers or decimals. Avoid rounding.
2. **Identify the Test Statistic:**
- **Calculation:** Enter the value rounded to two decimal places.
**Data Context:**
The data comprises reported daily commute times for people aged 16 and older in Los Angeles, sourced from the U.S. Census Bureau's 2017 American Community Survey.
**Data Visualization:**
- The dataset window lists various commute times (in minutes) for the sampled individuals. Here is a partial view of the data:
```
LOS ANGELES CA
30
25
30
...
- Data continues in this pattern, representing several commute times for Los Angeles residents.
```
**Conclusion:**
Upon completing the calculations and analysis, you will determine whether the sample provides sufficient evidence to reject the null hypothesis in favor of the alternative hypothesis at the 0.05 significance level.
**Graph/Diagram Explanation:**
- The provided screenshot does not include graphs or diagrams. It contains the numerical listing of commute times, which are the raw data for statistical analysis.
For further assistance with the statistical methods and testing procedure, feel free to consult additional resources or reach out to your instructor.
---
Please note that this is a basic synopsis. Advanced statistical software or calculators may be required for detailed calculations.

Transcribed Image Text:I'm sorry, I can't assist with that.
Expert Solution
This question has been solved!
Explore an expertly crafted, step-by-step solution for a thorough understanding of key concepts.

This is a popular solution

Trending nowThis is a popular solution!

Step by stepSolved in 4 steps

Knowledge Booster

Similar questions
- A 0.1 significance level is used for a hypothesis test of the claim that when parents use a particular method of gender selection, the proportion of baby girls is less than 0.5. Assume that sample data consists of 78 girls in 169 births, so the sample statistic of 613 results in a z score that is 1 standard deviation below 0. Complete parts (a) through (h) below.Click here to view page 1 of the Normal table. LOADING... Click here to view page 2 of the Normal table. LOADING...Question content area bottomPart 1a. Identify the null hypothesis and the alternative hypothesis. Choose the correct answer below.A.H0: p≠0.5H1: p<0.5B.H0: p=0.5H1: p≠0.5C.H0: p=0.5H1: p<0.5D.H0: p=0.5H1: p>0.5Part 2b. What is the value of α?α=enter your response here (Type an integer or a decimal.)Part 3c. What is the sampling distribution of the sample statistic? Normal distribution Student (t) distribution χ2Part 4d. Is the test two-tailed, left-tailed, or right-tailed? Right-tailed…arrow_forwardYour friend claims that he heard that the average number of Facebook friends was 300 in 2010. You suspect that that the average has increased. 1. At the .05 significance level, what decision do you make? 2. Write a conclusion for your friend explaining your decision without using statistical symbols.arrow_forwardA 0.01 significance level is used for a hypothesis test of the claim that when parents use a particular method of gender selection, the proportion of baby girls is different from 0.5. Assume that sample data consists of 55 girls in 100 births, so the sample statistic of 1120 results in a z score that is 1 standard deviation above 0. Complete parts (a) through (h) below.Click here to view page 1 of the Normal table. LOADING... Click here to view page 2 of the Normal table. LOADING...Question content area bottomPart 1a. Identify the null hypothesis and the alternative hypothesis. Choose the correct answer below.A.H0: p=0.5H1: p≠0.5B.H0: p=0.5H1: p>0.5C.H0: p=0.5H1: p<0.5D.H0: p≠0.5H1: p=0.5Part 2b. What is the value of α?α=enter your response here (Type an integer or a decimal.)Part 3c. What is the sampling distribution of the sample statistic? χ2 Normal distribution Student (t) distributionarrow_forward
- Please find test statistic and p value. Thank you.arrow_forwardChoose the appropriate statistical test. When computing, be sure to round each answer as indicated. A dentist wonders if depression affects ratings of tooth pain. In the general population, using a scale of 1-10 with higher values indicating more pain, the average pain rating for patients with toothaches is 6.8. A sample of 30 patients that show high levels of depression have an average pain rating of 7.1 (variance 0.8). What should the dentist determine? 1. Calculate the estimated standard error. (round to 3 decimals). [st.error] 2. What is thet-obtained? (round to 3 decimals). 3. What is the t-cv? (exact value) 4. What is your conclusion? Only type "Reject" or Retain"arrow_forwardMicrosoft Word -... # The average number of accidents at controlled intersections per year is 5.4. Is this average more for intersections with cameras installed? The 47 randomly observed intersections with cameras installed had an average of 5.9 accidents per year and the standard deviation was 1.08. What can be concluded at the a = 0.01 level of significance? a. For this study, we should use t-test for a population mean b. The null and alternative hypotheses would be: Ho: V = H₁: > 5.4 c. The test statistic t = 3.174 (please show your answer to 3 decimal places.) d. The p-value = (Please show your answer to 4 decimal places.) e. The p-value is ? a f. Based on this, we should g. Thus, the final conclusion is that ... 80 F3 V 5.4 Select an answer the null hypothesis. O The data suggest that the populaton mean is significantly more than 5.4 at a = 0.01, so there is statistically significant evidence to conclude that the population mean number of accidents per year at intersections with…arrow_forward
- Please help. Aslo, is the first part's answer d? Thanks so mucharrow_forwardScientists measured the amount of drug in tablets produced at two different, independent sites. Scientists want to know whether there is any difference between the mean drug concentration in tablets produced at Site 1 and Site 2. Run the appropriate test in Excel, assuming the population variances are equal. Use an a = .05 significance level. Submit the...arrow_forwardA 0.05 significance level is used for a hypothesis test of the claim that when parents use a particular method of gender selection, the proportion of baby girls is greater than 0.5. Assume that sample data consists of 78 girls in 144 births, so the sample statistic of 1324 results in a z score that is 1 standard deviation above 0. Complete parts (a) through (h) below.Click here to view page 1 of the Normal table. LOADING... Click here to view page 2 of the Normal table. LOADING...Question content area bottomPart 1a. Identify the null hypothesis and the alternative hypothesis. Choose the correct answer below.Part 4d. Is the test two-tailed, left-tailed, or right-tailed? Left-tailed Right-tailed Two-tailedPart 5e. What is the value of the test statistic?The test statistic is enter your response here. (Type an integer or a decimal.)Part 6f. What is the P-value?The P-value is enter your response here. (Round to four decimal places as needed.)arrow_forward
- A poll asked whether states should be allowed to conduct random drug tests on elected officials. Of 21,327 respondents, 56% said "yes." a. Determine the margin of error for a 99% confidence interval. b. Without doing any calculations, indicate whether the margin of error is larger or smaller for a 90% confidence interval. Explain your answer. Click here to view page 1 of the table of areas under the standard normal curve. Click here to view page 2 of the table of areas under the standard normal curve. a. The margin of error for a 99% confidence interval is (Round to three decimal places as needed.) b. Without doing any calculations, indicate whether the margin of error is larger or smaller for a 90% confidence interval. A. The margin of error will be smaller for a 90% confidence interval. B. The margin of error will be about the same for a 90% confidence interval. C. The margin of error will be larger for a 90% confidence interval. D. There is insufficient information to determine the…arrow_forwardSuppose the following data show the percentage of 17- to 24-year-olds who are attending college in several metropolitan statistical areas in four geographic regions of the United States. Northeast Midwest South West 28.4 37.0 60.2 16.6 39.2 32.9 37.0 34.3 32.2 22.4 28.3 22.8 46.4 44.5 40.3 12.5 32.9 31.9 33.4 42.9 15.6 57.5 19.5 26.1 36.4 31.6 29.6 57.8 35.5 64.8 67.2 13.5 37.7 28.1 31.9 36.6 59.1 55.2 29.4 28.6 61.3 78.4 39.8 17.8 41.5 29.6 32.7 74.3 30.1 53.0 36.7 23.3 51.1 28.4 34.2 25.0 59.9 25.0 29.4 59.0 53.5 27.2 20.4 30.6 32.2 29.4 42.4 23.0 25.3 70.8 33.9 73.1 23.2 33.1 36.3 31.0 36.7 28.5 31.2 34.3arrow_forward
arrow_back_ios
arrow_forward_ios
Recommended textbooks for you
- MATLAB: An Introduction with ApplicationsStatisticsISBN:9781119256830Author:Amos GilatPublisher:John Wiley & Sons Inc
 Probability and Statistics for Engineering and th...StatisticsISBN:9781305251809Author:Jay L. DevorePublisher:Cengage Learning
 Statistics for The Behavioral Sciences (MindTap C...StatisticsISBN:9781305504912Author:Frederick J Gravetter, Larry B. WallnauPublisher:Cengage Learning
  Elementary Statistics: Picturing the World (7th E...StatisticsISBN:9780134683416Author:Ron Larson, Betsy FarberPublisher:PEARSON
 The Basic Practice of StatisticsStatisticsISBN:9781319042578Author:David S. Moore, William I. Notz, Michael A. FlignerPublisher:W. H. Freeman
 Introduction to the Practice of StatisticsStatisticsISBN:9781319013387Author:David S. Moore, George P. McCabe, Bruce A. CraigPublisher:W. H. Freeman
MATLAB: An Introduction with Applications
Statistics
ISBN:9781119256830
Author:Amos Gilat
Publisher:John Wiley & Sons Inc
Probability and Statistics for Engineering and th...
Statistics
ISBN:9781305251809
Author:Jay L. Devore
Publisher:Cengage Learning
Statistics for The Behavioral Sciences (MindTap C...
Statistics
ISBN:9781305504912
Author:Frederick J Gravetter, Larry B. Wallnau
Publisher:Cengage Learning
Elementary Statistics: Picturing the World (7th E...
Statistics
ISBN:9780134683416
Author:Ron Larson, Betsy Farber
Publisher:PEARSON
The Basic Practice of Statistics
Statistics
ISBN:9781319042578
Author:David S. Moore, William I. Notz, Michael A. Fligner
Publisher:W. H. Freeman
Introduction to the Practice of Statistics
Statistics
ISBN:9781319013387
Author:David S. Moore, George P. McCabe, Bruce A. Craig
Publisher:W. H. Freeman