Advanced Engineering Mathematics
10th Edition
ISBN: 9780470458365
Author: Erwin Kreyszig
Publisher: Wiley, John & Sons, Incorporated
expand_more
expand_more
format_list_bulleted
Question

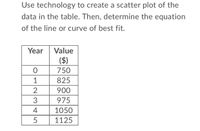
Transcribed Image Text:Use technology to create a scatter plot of the
data in the table. Then, determine the equation
of the line or curve of best fit.
Year
Value
($)
750
1
825
900
3
975
4
1050
1125
Expert Solution
This question has been solved!
Explore an expertly crafted, step-by-step solution for a thorough understanding of key concepts.
This is a popular solution
Trending nowThis is a popular solution!
Step by stepSolved in 2 steps with 2 images

Knowledge Booster
Similar questions
- Calculate the slope. In words, state what the magnitude and sign of the number you calculated means.arrow_forwardUse the information for questions 4-5. EDUCATION The table gives the number of hours spent studying for a math exam and the final exam grade. y 4 Study Hours Grade 3 2 1 95 85 77 90 70 60 92 75 85 4. Draw a scatter plot of the data. Draw in the line of best fit. 75 5. What is the equation for the line of best fit?arrow_forwardEstimate the slope of the line. y 10 9 8 7 6 5 4 3 2 1 1 72 3 4 5 6 7 8 9 10arrow_forward
- Forest Fires and Acres Burned An environmentalist wants to determine the relationships between the numbers (in thousands) of forest fires over the year and the number (in hundred thousands) of acres burned. The data for 6 recent years are shown. Number of fires x 58 47 84 62 57 45 Number of acres burned y 19 26 51 15 30 15 Send data to Excel Part 1 of 5 Your Answer is correct (a) Draw the scatter plot for the variables. Fires and Acres Burned Acres burned 100,000s y 5 10 15 20 25 30 35 40 45 50 55 60 65 70 x 10 20 30 40 50 60 70 80 90 0 Fires 1000s Part: 1 / 5 1 of 5 Parts Complete Part 2 of 5 (b) Compute the value of the correlation coefficient. Round your answer to at least three decimal places. r=?arrow_forwardIdentify the equation that represents the line of the best fit on this scatter plotarrow_forwardGraph the inverse of the provided graph on the accompanying set of axes. You must plot at least 5 points. *Click the graph to make a point. Click it again to erase.* 1 2 3 4 56 7arrow_forward
- Display the accompanying data in a dot plot. Describe the differences in how the stem-and-leaf plot and the dot plot show patterns in the data. Click the icon to view the data. Construct a dot plot. Choose the correct graph below. A. O C. 1 1 2 2 4 ■■ ■ 3 3 N B. D. 0 0 1 10 4 2 20 F3₂ 30 40arrow_forwardMake a scatter plot of the data and determine which type of model best fits the data. (-3,-1), (-2,0), (-1,1), (0,2), (1,3), (2,4)arrow_forwardKate measured some leaves.her data is shownarrow_forward
arrow_back_ios
SEE MORE QUESTIONS
arrow_forward_ios
Recommended textbooks for you
 Advanced Engineering MathematicsAdvanced MathISBN:9780470458365Author:Erwin KreyszigPublisher:Wiley, John & Sons, Incorporated
 Numerical Methods for EngineersAdvanced MathISBN:9780073397924Author:Steven C. Chapra Dr., Raymond P. CanalePublisher:McGraw-Hill Education
 Introductory Mathematics for Engineering Applicat...Advanced MathISBN:9781118141809Author:Nathan KlingbeilPublisher:WILEY
 Mathematics For Machine TechnologyAdvanced MathISBN:9781337798310Author:Peterson, John.Publisher:Cengage Learning,


Advanced Engineering Mathematics
Advanced Math
ISBN:9780470458365
Author:Erwin Kreyszig
Publisher:Wiley, John & Sons, Incorporated

Numerical Methods for Engineers
Advanced Math
ISBN:9780073397924
Author:Steven C. Chapra Dr., Raymond P. Canale
Publisher:McGraw-Hill Education

Introductory Mathematics for Engineering Applicat...
Advanced Math
ISBN:9781118141809
Author:Nathan Klingbeil
Publisher:WILEY

Mathematics For Machine Technology
Advanced Math
ISBN:9781337798310
Author:Peterson, John.
Publisher:Cengage Learning,

