
MATLAB: An Introduction with Applications
6th Edition
ISBN: 9781119256830
Author: Amos Gilat
Publisher: John Wiley & Sons Inc
expand_more
expand_more
format_list_bulleted
Related questions
Topic Video
Question
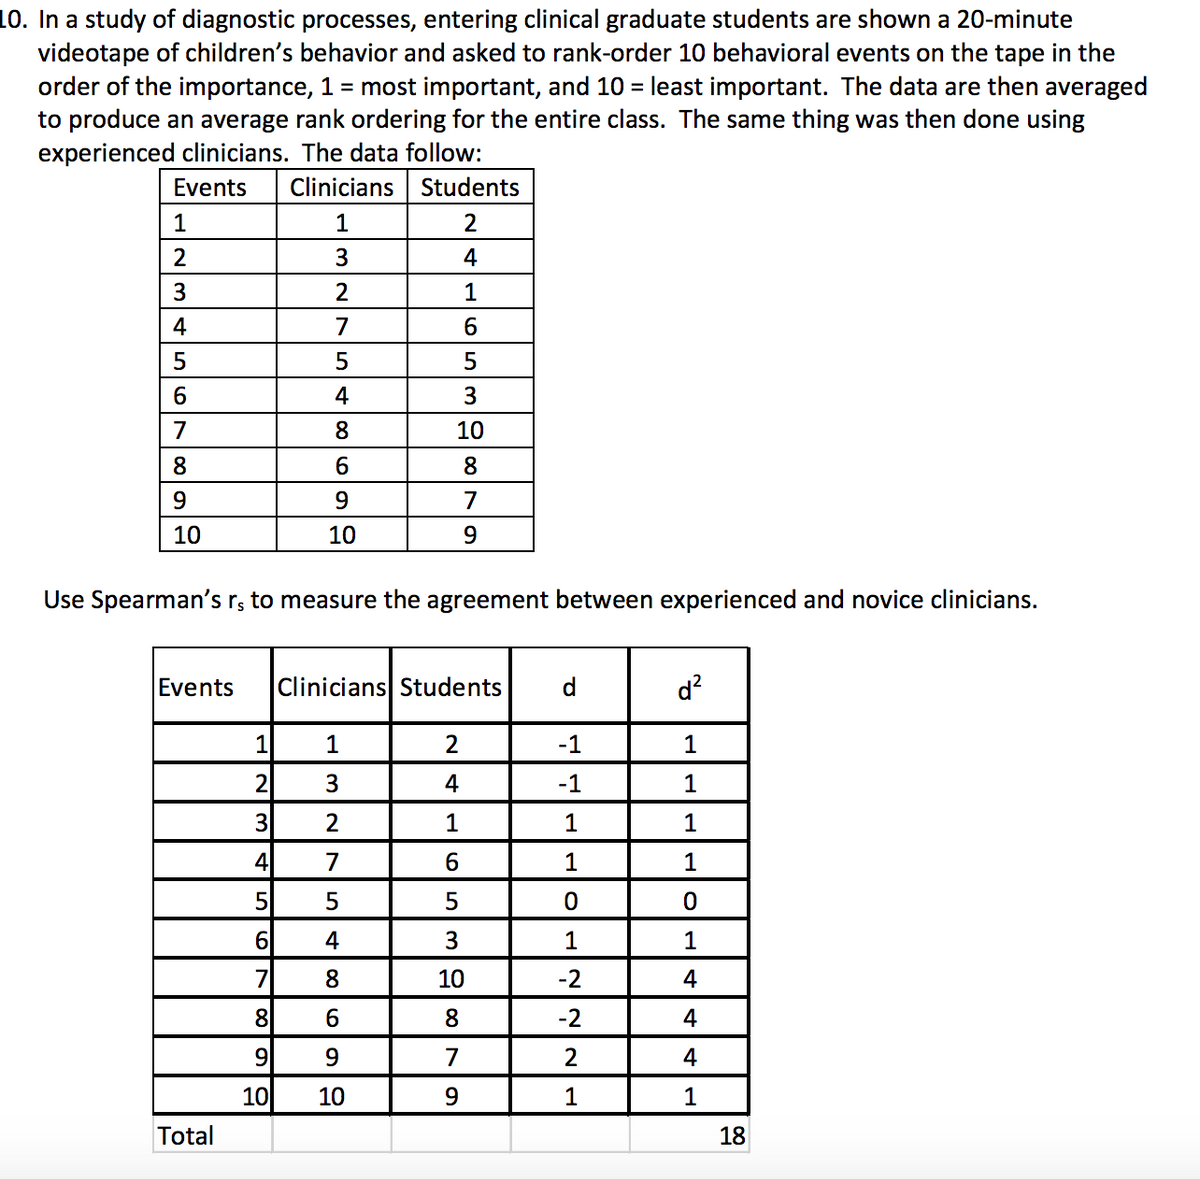

Transcribed Image Text:10. In a study of diagnostic processes, entering clinical graduate students are shown a 20-minute
videotape of children's behavior and asked to rank-order 10 behavioral events on the tape in the
order of the importance, 1 = most important, and 10 = least important. The data are then averaged
to produce an average rank ordering for the entire class. The same thing was then done using
experienced clinicians. The data follow:
Events
Clinicians Students
1
1
2
2
4
3
2
1
4
7
5
4
7
8.
10
8
6.
8.
9
7
10
10
Use Spearman's r, to measure the agreement between experienced and novice clinicians.
Events
Clinicians Students
d.
d?
1
1
2
-1
3
4
-1
1
3
2
1
1
1
4
7
6
1
1
5
5
4
3
1
1
7
8.
10
-2
4
8
8
-2
4
9
9.
7
4
10
10
9.
1
1
Total
18
Expert Solution
This question has been solved!
Explore an expertly crafted, step-by-step solution for a thorough understanding of key concepts.

This is a popular solution

Trending nowThis is a popular solution!

Step by stepSolved in 2 steps

Knowledge Booster


Learn more about
Need a deep-dive on the concept behind this application? Look no further. Learn more about this topic, statistics and related others by exploring similar questions and additional content below.Similar questions
- What is the Testing Mean Difference and give an example about it. Explain the process of creating a hypothesis and which R codes to use. Lastly, explain how you would make a conclusion on your hypothesis based on your p-value.arrow_forwardIn a study assessing helping behavior among college students on their way to class, you recruit 10 students. You tell some participants that they are late for class and need to rush. You tell others they are right on time. Finally, you tell others they have lots of time before class. As they walk across campus, they come across a man (actually a confederate) who appears to need help. You measure the extent to which the participant noticed that the confederate needed help (1 = did not notice to 9 = really noticed). Which hypothesis test would you calculate? F test Independent sample t-test z test Dependent sample t-testarrow_forwardGSS 2018 respondents were asked to rate their level of agreement to the statement, “Differences in income in America are too large.” Responses were measured on a 5-point scale: 1 = strongly agree, 2 = agree, 3 = neutral, 4 = disagree, and 5 = strongly disagree. Strong Democrats had an average score of 1.69 (s = 1.04, N = 86) while strong Republicans had an average score of 2.11 (s = 1.05, N = 67). The estimated standard error of the difference between meansis 0.17. What is the appropriate test statistic? Why? Test the null hypothesis with a one-tailed test (strong Democrats are more likely to agree with the statement than strong Republicans); α = .05. What do you conclude about the difference in attitudes for these two political groups? If you conducted a two-tailed test with α = .05, would your decision have been different?arrow_forward
- Describe the differences between symmetrical and asymmetrical measures of association.arrow_forwardMs Best is a high school math teacher. Ms. Best has two sections of geometry. She teaches one section using a traditional approach. The second section Ms Best uses a tasked-based learning approach. The table below summarizes the descriptive statistics for the final exam. Ms Best concludes that the tasked-based learning approach students consistently scored higher than the traditional students. Is Ms Best conclusion correct? Why? Be very thorough in your response and use all the statistics reported and their interpretation to support your answer. Tasked-Based Traditional Learning Mean 73.1 Mean 83.5 Median 73.0 Median 82.0 Mode 73.0 Mode 83.0 Standard Standard 17.5 13.2 Deviation Deviationarrow_forwardNeed it in 15 minarrow_forward
- Does reading the Harry Potter books encourage tolerance? It depends. Italian fifth graders were (randomly) split into two groups. Half the students met with researchers and discussed passages from the Harry Potter books that handled prejudice, while the others talked about unrelated sections. *Data are fabricated but match actual results When determining whether or not the main effects and interactions were significant, for the sake of this assignment, let’s say that the difference between the calculated means/differences must be .7 or higher to be significant. Posttest attitudes toward immigration (7-pt scale) Discussed prejudice-related sections Discussed unrelated sections High identification w/ Harry 6.2 5.0 Low identification w/ Harry 4.2 4.4 Is there a main effect of identification? (calculate marginal means). Is there a main effect of section? (calculate marginal means). Is there an interaction effect? (calculate “difference of differences”)…arrow_forwardHow does the student compare to typically achieving peers?” Write the narrative in a way that a parent could understand and use statistical language.arrow_forward
arrow_back_ios
arrow_forward_ios
Recommended textbooks for you
- MATLAB: An Introduction with ApplicationsStatisticsISBN:9781119256830Author:Amos GilatPublisher:John Wiley & Sons Inc
 Probability and Statistics for Engineering and th...StatisticsISBN:9781305251809Author:Jay L. DevorePublisher:Cengage Learning
 Statistics for The Behavioral Sciences (MindTap C...StatisticsISBN:9781305504912Author:Frederick J Gravetter, Larry B. WallnauPublisher:Cengage Learning
  Elementary Statistics: Picturing the World (7th E...StatisticsISBN:9780134683416Author:Ron Larson, Betsy FarberPublisher:PEARSON
 The Basic Practice of StatisticsStatisticsISBN:9781319042578Author:David S. Moore, William I. Notz, Michael A. FlignerPublisher:W. H. Freeman
 Introduction to the Practice of StatisticsStatisticsISBN:9781319013387Author:David S. Moore, George P. McCabe, Bruce A. CraigPublisher:W. H. Freeman
MATLAB: An Introduction with Applications
Statistics
ISBN:9781119256830
Author:Amos Gilat
Publisher:John Wiley & Sons Inc
Probability and Statistics for Engineering and th...
Statistics
ISBN:9781305251809
Author:Jay L. Devore
Publisher:Cengage Learning
Statistics for The Behavioral Sciences (MindTap C...
Statistics
ISBN:9781305504912
Author:Frederick J Gravetter, Larry B. Wallnau
Publisher:Cengage Learning
Elementary Statistics: Picturing the World (7th E...
Statistics
ISBN:9780134683416
Author:Ron Larson, Betsy Farber
Publisher:PEARSON
The Basic Practice of Statistics
Statistics
ISBN:9781319042578
Author:David S. Moore, William I. Notz, Michael A. Fligner
Publisher:W. H. Freeman
Introduction to the Practice of Statistics
Statistics
ISBN:9781319013387
Author:David S. Moore, George P. McCabe, Bruce A. Craig
Publisher:W. H. Freeman