
Advanced Engineering Mathematics
10th Edition
ISBN: 9780470458365
Author: Erwin Kreyszig
Publisher: Wiley, John & Sons, Incorporated
expand_more
expand_more
format_list_bulleted
Related questions
Question
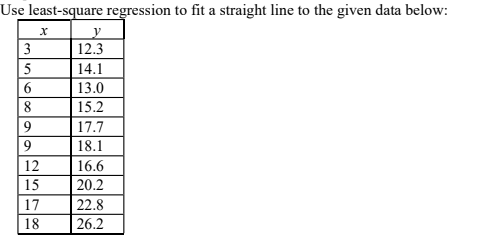

Transcribed Image Text:Use least-square regression to fit a straight line to the given data below:
x
y
3
12.3
5
14.1
6
13.0
8
15.2
9
17.7
9
18.1
16.6
20.2
22.8
26.2
12
15
17
18
Expert Solution
This question has been solved!
Explore an expertly crafted, step-by-step solution for a thorough understanding of key concepts.

Step by stepSolved in 2 steps with 1 images

Knowledge Booster

Similar questions
- Data were gathered and displayed on the scatter plot. 15 y 14 13 12 11 10 9 8 7 6 5 4 3 2 1 0 1 2 3 4 5 6 7 8 9 10 11 12 13 14 15 Which of the following is the best equation to model the data? ŷ = 11.5(0.81)* Oŷ = 8.1(0.115)* Oŷ= -0.115x+8.1 Oŷ=-0.81x+11.5arrow_forwardThe following data is given: 3 4 6. 12 14 2 4 5 6. 7. 9. 11 Use linear least-squares regression to determine the coefficients m and b in the function y - mx + b that best fit the data. Use Eq. (6.5) to determine the overall error.arrow_forwardCompute the least-squares regression equation for the given data set. Use a TI-84 calculator. Round the slope and y-intercept to at least four decimal places. 5.8 4.1 6.5 4.6 6.6 5.8 5.2 2.0 4.9 1.0 4.1 1.2 1.9 2.9 x y Send data to Excel Regression line equation: yarrow_forward
- Draw a graph of the least-squares regression line on your scatterplot. (For hand-drawing, round the slope and y-intercept to one decimal place before drawing the line.) Be sure to show how you were able to plot the line starting with its equation. Model City Miles per Gallon Highway Miles per Gallon Acura RLX 20 29 BMW 530i 24 34 Buick LaCrosse eAssist 25 35 Chevrolet Malibu 29 36 Ford Hybrid FWD 43 41 Honda Civic 32 42 Infiniti Q50 Red Sport 20 26 Kia Forte 30 40 Lexus ES 350 22 33 Mercedes Benz AMG S 21 30 Mini Cooper Clubman 24 32 Nissan Maxima 20 30 Suburu Legacy AWD 25 34 Toyota Prius ECO 58 53arrow_forwardThe following data represent the commute time (in minutes) x and a score on a well-being survey y. The equation of the least-squares regression line is y = - 0.0423x + 69.1961 and the standard error of the estimate is 0.5262. Complete parts (a) through (e) below. 15 25 35 45 60 82 115 D 69.0 68.3 66.8 66.2 66.5 64.2 y 67.4 (a) Predict the mean well-being index composite score of all individuals whose commute time is 30 minutes. y = (Round to two decimal places as needed.) (b) Construct a 90% confidence interval for the mean well-being index composite score of all individuals whose commute time is 30 minutes. Lower Bound (Round to two decimal places as needed.) Upper Bound |(Round to two decimal places as needed.) (c) Predict the well-being index composite score of Jane, whose commute time is 30 minutes. y =(Round to two decimal places as needed.)arrow_forwardWhich of the multivariate regression parameters listed below would be best interpreted as: the proportion of variation in the dependent variable explain by all the independent variables in the model. a b1 X1 R2arrow_forward
arrow_back_ios
arrow_forward_ios
Recommended textbooks for you
- Advanced Engineering MathematicsAdvanced MathISBN:9780470458365Author:Erwin KreyszigPublisher:Wiley, John & Sons, Incorporated
 Numerical Methods for EngineersAdvanced MathISBN:9780073397924Author:Steven C. Chapra Dr., Raymond P. CanalePublisher:McGraw-Hill Education
 Introductory Mathematics for Engineering Applicat...Advanced MathISBN:9781118141809Author:Nathan KlingbeilPublisher:WILEY
  Mathematics For Machine TechnologyAdvanced MathISBN:9781337798310Author:Peterson, John.Publisher:Cengage Learning,

Advanced Engineering Mathematics
Advanced Math
ISBN:9780470458365
Author:Erwin Kreyszig
Publisher:Wiley, John & Sons, Incorporated
Numerical Methods for Engineers
Advanced Math
ISBN:9780073397924
Author:Steven C. Chapra Dr., Raymond P. Canale
Publisher:McGraw-Hill Education
Introductory Mathematics for Engineering Applicat...
Advanced Math
ISBN:9781118141809
Author:Nathan Klingbeil
Publisher:WILEY
Mathematics For Machine Technology
Advanced Math
ISBN:9781337798310
Author:Peterson, John.
Publisher:Cengage Learning,