
MATLAB: An Introduction with Applications
6th Edition
ISBN: 9781119256830
Author: Amos Gilat
Publisher: John Wiley & Sons Inc
expand_more
expand_more
format_list_bulleted
Related questions
Question

Transcribed Image Text:2.
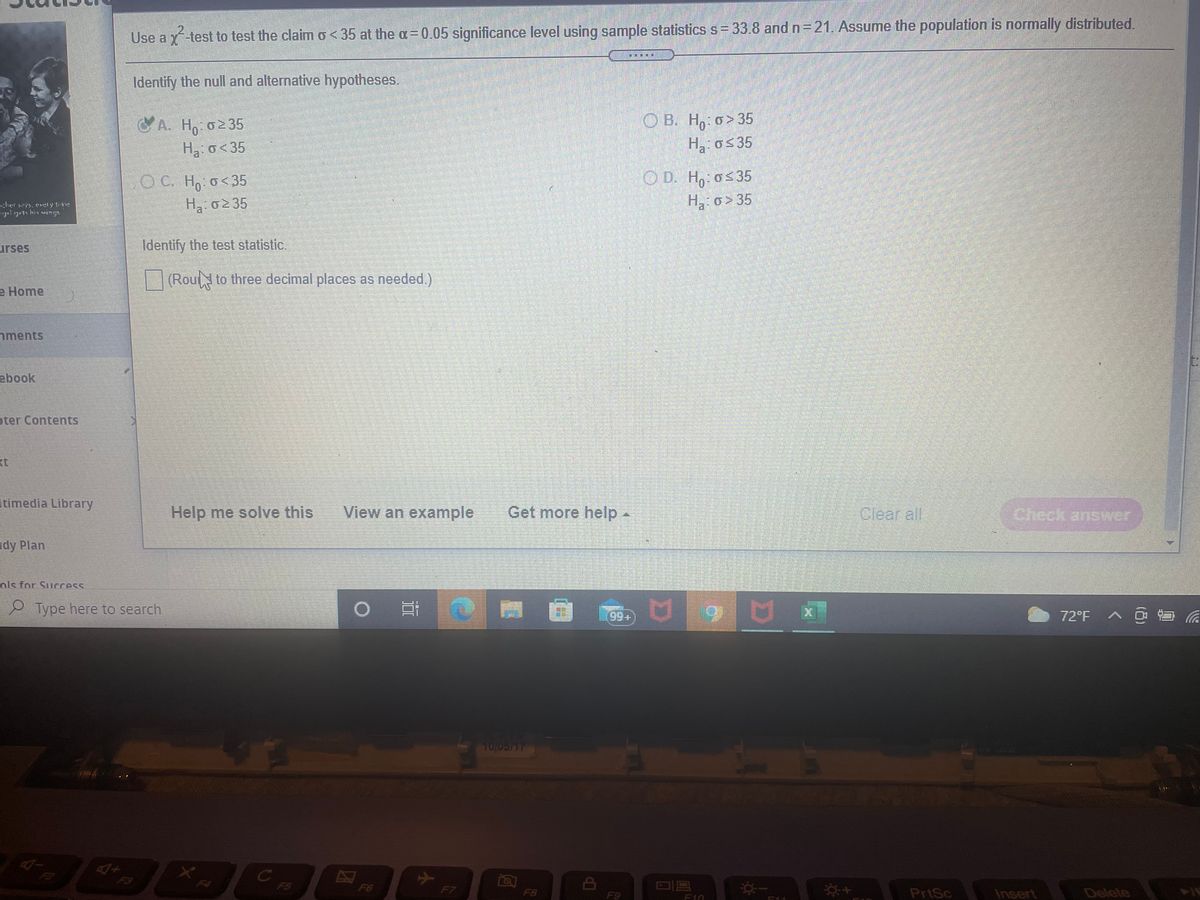
Use a -test to test the claim o<35 at the a=0.05 significance level using sample statistics s= 33.8 and n321. Assume the population is normally distributed.
期:
Identify the null and alternative hypotheses.
CA. H, 0235
O B. H, o>35
H o<35
H, os35
OC. H, o<35
O D. H,: os35
cher wys. eagly 1
lges bir ing
H, o235
H o> 35
urses
Identify the test statistic.
(Roul to three decimal places as needed.)
е Home
nments
ebook
oter Contents
Itimedia Library
Help me solve this
View an example
Get more help-
Clear all:
Check ansWET
dy Plan
ols for Sucress
Type here to search
99+
72°F A
56
F3
容+
F5
F6
Delete
F7
F8
F9
PriSc
Insert
F10
(0)
Expert Solution
This question has been solved!
Explore an expertly crafted, step-by-step solution for a thorough understanding of key concepts.

Step by stepSolved in 2 steps with 2 images

Knowledge Booster

Similar questions
- Kenneth, a competitor in cup stacking, claims that his average stacking time is 8.2 seconds. During a practice session, Kenneth has a sample stacking time mean of 7.8 seconds based on 11 trials. At the 4% significance level, does the data provide sufficient evidence to conclude that Kenneth's mean stacking time is less than 8.2 seconds? Accept or reject the hypothesis given the sample data below. H0:μ=8.2 seconds; Ha:μ<8.2 seconds α=0.04 (significance level) z0=−1.75 p=0.0401 Select the correct answer below: a. Do not reject the null hypothesis because the p-value 0.0401 is greater than the significance level α=0.04. b. Reject the null hypothesis because the p-value 0.0401 is greater than the significance level α=0.04. c. Reject the null hypothesis because the value of z is negative. d. Reject the null hypothesis because |−1.75|>0.04. e. Do not reject the null hypothesis because |−1.75|>0.04.arrow_forwardq11arrow_forwardAssume that you plan to use a significance level of a= 0.05 to test the claim that p1 = p2 . Use the given sample sizes and numbers of successes to find the P-value for the hypothesis test. n1 = 50 x1 = 8 n2 = 50 x2 = 7arrow_forward
- Conduct the hypothesis test and provide the test statistic and the critical value, and state the conclusion. A company claims that its packages of 100 candies are distributed with the following color percentages: 15% red, 21% orange, 12% yellow, 14% brown, 24% blue, and 14% green. Use the given sample data to test the claim that the color distribution is as claimed. Use a 0.025 significance level. E Click the icon to view the color counts for the candy in the package. Click here to view the chi-square distribution table. The test statistic is (Round to two decimal places as needed.) The critical value is (Round to three decimal places as needed.) State the conclusion. Ho. There sufficient evidence to warrant rejection of the claim that the color distribution is as claimed. Candy Package Counts Candy Counts Number in Package Color Red 14 Orange 23 Yellow 10 Brown 7 Blue 27 Green 19 Enter vOur C newer in ooearrow_forwardConsider a sample of 49 football games, where 28 of them were won by the home team. Use a 0.10 significance level to test the claim that the probability that the home team wins is greater than one-half. Identify the null and alternative hypotheses for this test. Choose the correct answer below. OA. Ho: p=0.5 H₁: p *0.5 B. Ho: p=0.5 H₁: p 0.5 H₁: p=0.5 D. Ho: p=0.5 H₁: p>0.5 Identify the test statistic for this hypothesis test. The test statistic for this hypothesis test is (Round to two decimal places as needed.)arrow_forwardPerform a hypothesis test to determine whether there is a difference in the mean attendance of teams between the two groups created in Part F. Use a 0.05 level of significance in your testing procedures. Hint: When calculating your pooled sample variance and your test statistic, assume the Top 10 data is sample 1 and the Bottom 10 data is sample 2. Decision Rule -t < or t > = REJECT H0 Value of Pooled Sample Variances Value of test statistic Decision: enter Reject or Do Not Reject Is there a difference in the mean attendance between the two groups assuming a 0.05 level of significance? Enter Yes or No. Another variable that can impact attendance is the team's win-loss record. Teams that are winning more games are thought to have increased attendance as fans prefer to see their home team "win" rather than "lose" (although for some teams such as the Chicago Cubs, this is not always an established relationship!). Create 2 samples…arrow_forward
- Use a y-test to test the claim o 40 Hg:o5 40 H3: o> 40 Identify the test statistic. (Round to three decimal places as needed.) Identify the critical value(s). (Round to three decimal places as needed. Use a comma to separate answers as needed.) Choose the correct conclusion below. O A. Reject Ho. There is not enough evidence at the 10% level of significance to support the claim. O B. Reject Ho. There is enough evidence at the 10% level of significance to support the claim. O C. Fail to reject Ho. There is enough evidence at the 10% level of significance to support the claim. Fail to reject Ho. There is not enough evidence at the 10% level of significance to support the claim. Click to select your answer(s). MacBook Air esc F2 F3 F4 F1 @ 23 $4 % 2 4arrow_forwardUse a y-test to test the claim o = 0.48 at the a = 0.01 significance level using sample statistics s = 0.466 and n = 15. Assume the population is normally distributed. Identify the null and alternative hypotheses. YA. Ho: o? = 0.48 O B. Ho: o 20.48 H:o +0.48 H,: o 0.48 Identify the test statistic. (Round to two decimal places as needed.)arrow_forward6arrow_forward
- 20. Assume that the samples are independent and have been randomly selected. Use the given sample data to test the claim that p1 < p2. Use a significance level of 0.01. Show work. Sample 1 Sample 2 n1 = 85 n2 = 90 x1 = 38 x2 = 23arrow_forwardIs Friday the 13th Unlucky? The table shows the number of hospital admissions for Friday the 6th and Friday the 13th. Assume that the two samples are randomly selected. At the 0.05 significance level, test the claim that there is no mean difference in the number of hospital admissions for Friday the 6th and Friday the 13th.(Be sure to subtract in the same direction). Friday 6th Friday 13th Difference 4 2 6 10 5 6 9 13 3 2 11 15 12 12arrow_forwardAssume that a simple random sample has been selected and test the given claim. Use the P-value method for testing hypotheses. Identify the null and alternative hypotheses, test statistic, P-value, and state the final conclusion that addresses the original claim.The ages of actresses when they won an acting award is summarized by the statistics n=79, x=35.4 years, and s=11.4 years. Use a 0.05 significance level to test the claim that the mean age of actresses when they win an acting award is 32 years.Question content area bottomPart 1What are the hypotheses?A.H0: μ=32 yearsH1: μ≥32 yearsB.H0: μ≠32 yearsH1: μ=32 yearsC.H0: μ=32 yearsH1: μ<32 yearsD.H0: μ=32 yearsH1: μ≠32 yearsPart 2Identify the test statistic.t=enter your response here (Round to three decimal places as needed.)Part 3Identify the P-value.The P-value is enter your response here. (Round to four decimal places as needed.) Part 4State the final conclusion that addresses the original claim. Choose the…arrow_forward
arrow_back_ios
SEE MORE QUESTIONS
arrow_forward_ios
Recommended textbooks for you
- MATLAB: An Introduction with ApplicationsStatisticsISBN:9781119256830Author:Amos GilatPublisher:John Wiley & Sons Inc
 Probability and Statistics for Engineering and th...StatisticsISBN:9781305251809Author:Jay L. DevorePublisher:Cengage Learning
 Statistics for The Behavioral Sciences (MindTap C...StatisticsISBN:9781305504912Author:Frederick J Gravetter, Larry B. WallnauPublisher:Cengage Learning
  Elementary Statistics: Picturing the World (7th E...StatisticsISBN:9780134683416Author:Ron Larson, Betsy FarberPublisher:PEARSON
 The Basic Practice of StatisticsStatisticsISBN:9781319042578Author:David S. Moore, William I. Notz, Michael A. FlignerPublisher:W. H. Freeman
 Introduction to the Practice of StatisticsStatisticsISBN:9781319013387Author:David S. Moore, George P. McCabe, Bruce A. CraigPublisher:W. H. Freeman
MATLAB: An Introduction with Applications
Statistics
ISBN:9781119256830
Author:Amos Gilat
Publisher:John Wiley & Sons Inc
Probability and Statistics for Engineering and th...
Statistics
ISBN:9781305251809
Author:Jay L. Devore
Publisher:Cengage Learning
Statistics for The Behavioral Sciences (MindTap C...
Statistics
ISBN:9781305504912
Author:Frederick J Gravetter, Larry B. Wallnau
Publisher:Cengage Learning
Elementary Statistics: Picturing the World (7th E...
Statistics
ISBN:9780134683416
Author:Ron Larson, Betsy Farber
Publisher:PEARSON
The Basic Practice of Statistics
Statistics
ISBN:9781319042578
Author:David S. Moore, William I. Notz, Michael A. Fligner
Publisher:W. H. Freeman
Introduction to the Practice of Statistics
Statistics
ISBN:9781319013387
Author:David S. Moore, George P. McCabe, Bruce A. Craig
Publisher:W. H. Freeman