
A First Course in Probability (10th Edition)
10th Edition
ISBN: 9780134753119
Author: Sheldon Ross
Publisher: PEARSON
expand_more
expand_more
format_list_bulleted
Related questions
Question

Transcribed Image Text:5
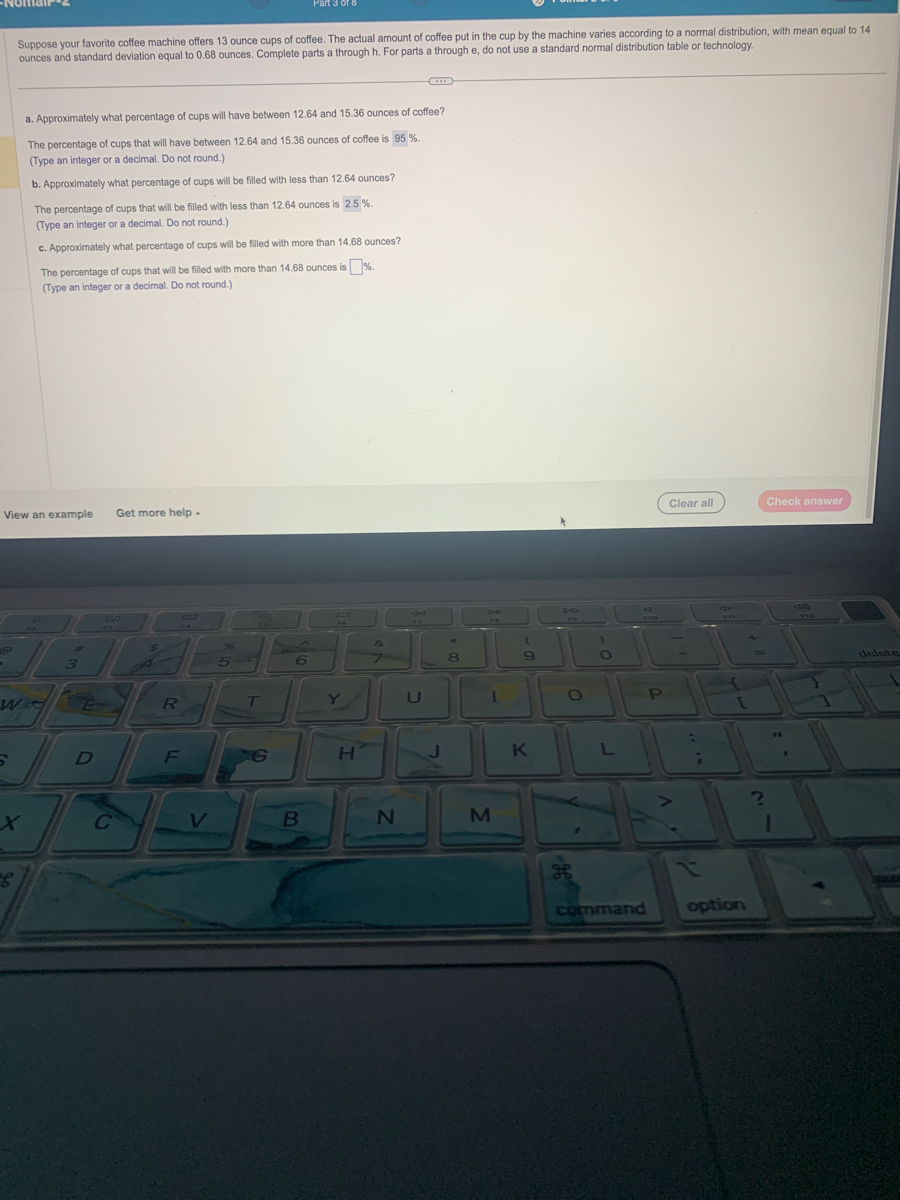
Suppose your favorite coffee machine offers 13 ounce cups of coffee. The actual amount of coffee put in the cup by the machine varies according to a normal distribution, with mean equal to 14
ounces and standard deviation equal to 0.68 ounces. Complete parts a through h. For parts a through e, do not use a standard normal distribution table or technology.
View an example Get more help -
S
a. Approximately what percentage of cups will have between 12.64 and 15.36 ounces of coffee?
The percentage of cups that will have between 12.64 and 15.36 ounces of coffee is 95%.
(Type an integer or a decimal. Do not round.)
b. Approximately what percentage of cups will be filled with less than 12.64 ounces?
The percentage of cups that will be filled with less than 12.64 ounces is 2.5 %.
(Type an integer or a decimal. Do not round.)
W
wa
c. Approximately what percentage of cups will be filled with more than 14.68 ounces?
The percentage of cups that will be filled with more than 14.68 ounces is %.
(Type an integer or a decimal. Do not round.)
3
D
80
H
C
R
F
V
96
Part 3 of 8
T
6
B
Y
H
&
N
U
J
8
1
M
9
K
DD
O
O
L
command
P
Clear all
:
*
ar
RSS
option
Check answer
FE
?
1
3)
V12
Expert Solution
This question has been solved!
Explore an expertly crafted, step-by-step solution for a thorough understanding of key concepts.

This is a popular solution

Trending nowThis is a popular solution!

Step by stepSolved in 5 steps with 3 images

Knowledge Booster

Similar questions
- The following set of data represents the number of orders filled by a national-chain restaurant during a two week period. Construct a five number summary for the the data. 66, 75, 68, 89, 86, 73, 67, 75, 75, 82, 85, 74, 67, 61 (Round to the nearest hundredth, if needed). Min _________________ Lower Quartile _________________ Median __________________ Upper Quartile _________________ Maximum __________________ What is the range and the interquartile range (IQR)? Range __________________ Interquartile Range (IQR) ___________________arrow_forwardThe highway mileage (mpg) for a sample of 8 different models of a car company can be found below. Find the mean, median, mode, and standard deviation. Round to one decimal place as needed.20, 23, 26, 28, 30, 32, 33, 33arrow_forwardplease answer the question in the photo. Thank youarrow_forward
- The highway mileage (mpg) for a sample of 8 different models of a car company can be found below. Find the mean, median, mode, and standard deviation. Round to one decimal place as needed. Use technology.20, 22, 26, 27, 29, 32, 33, 33Mean = Median = Mode = Standard Deviation =arrow_forwardClear writing pleasearrow_forwardA nutritionist wants to determine how much time nationally people spend eating and drinking. Suppose for a random sample of 901 people age 15 or older, the mean amount of time spent eating or drinking per day is 1.85 hours with a standard deviation of 0.57 hour. Complete C and D.arrow_forward
- A normally distributed data set has a mean of 0 and the standard divitation of 2. What is the percent of valleys between -4.0 and 2.0?arrow_forwardThe highway mileage (mpg) for a sample of 8 different models of a car company can be found below. Find the mean, median, mode, and standard deviation. Round to one decimal place as needed. 20, 23, 25, 28, 30, 32, 33, 33 Mean = Median = Mode = Standard Deviation =arrow_forwardUse the Empirical Rule. The mean speed of a sample of vehicles along a stretch of highway is 68 miles per hour, with a standard deviation of 3 miles per hour. Estimate the percent of vehicles whose speeds are between 65 miles per hour and 71 miles per hour. (Assume the data set has a bell-shaped distribution.) Approximately nothing% of vehicles travel between 65 miles per hour and 71 miles per hour.arrow_forward
- Help The mean useful life of car batteries is 48 months. They have a standard deviation of 5. Assume the useful life of batteries is normally distributed. a. Calculate the percent of batteries with a useful life of less than 43 months. (Round your answer to the nearest hundredth percent.) b. Calculate the percent of batteries that will last longer than 53 months. (Round your answer to the nearest hundredth percent.) a. Percent of batteries % b. Percent of batteries Next > Mc Graw Hill ! 1 Q A @ 2 Ne N r option W #3 S % So E X command $ 4 D R C < Prev % LO 5 F T 14 of 14 6 V G ⠀⠀ Y & 7 #Y H B 4 8 Dal J N 1 K M O Save & Exit L < MOSISO . command H Submit 96 1 ? opticarrow_forwardThe highway mileage (mpg) for a sample of 8 different models of a car company can be found below. Find the mean, median, mode, and standard deviation. Round to one decimal place as needed. 20, 23, 26, 28, 29, 31, 35, 35 Mean = Median Mode = Standard Deviation =arrow_forwardThe average driver spends $39 at the gas station each week with a standard deviation of $11. Assuming that the amount a driver spends on gas follows a normal distribution; find the percentage of drivers who spend: 1. More than $67? 2. Less than $25? 3. Between $25 and $67arrow_forward
arrow_back_ios
SEE MORE QUESTIONS
arrow_forward_ios
Recommended textbooks for you
- A First Course in Probability (10th Edition)ProbabilityISBN:9780134753119Author:Sheldon RossPublisher:PEARSON

A First Course in Probability (10th Edition)
Probability
ISBN:9780134753119
Author:Sheldon Ross
Publisher:PEARSON