
MATLAB: An Introduction with Applications
6th Edition
ISBN: 9781119256830
Author: Amos Gilat
Publisher: John Wiley & Sons Inc
expand_more
expand_more
format_list_bulleted
Related questions
Question
thumb_up100%
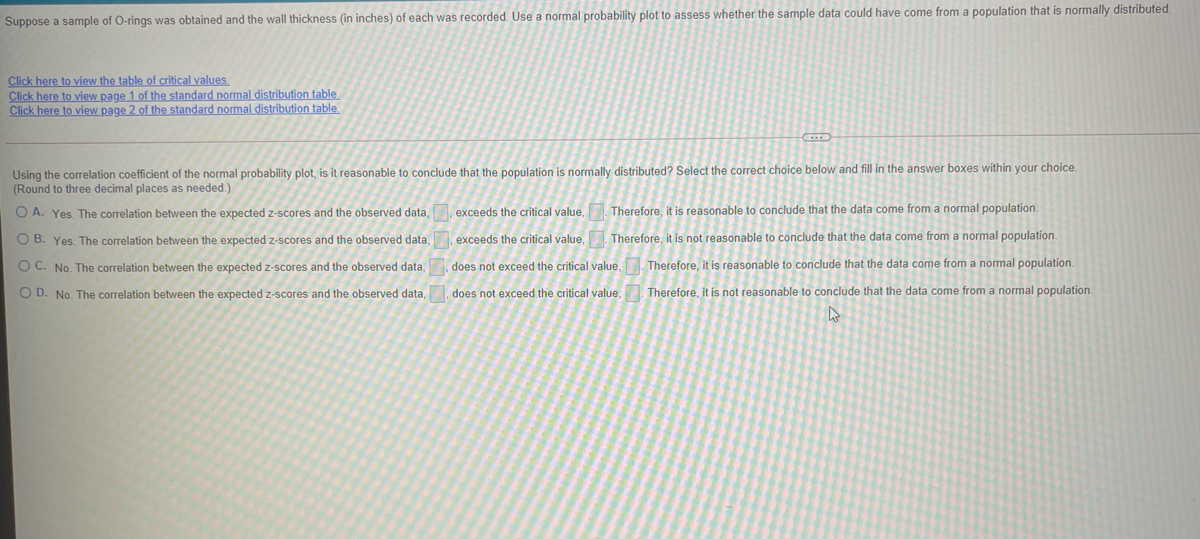

Transcribed Image Text:Suppose a sample of O-rings was obtained and the wall thickness (in inches) of each was recorded. Use a normal probability plot to assess whether the sample data could have come from a population that is normally distributed.
Click here to view the table of critical values
Click here to view page 1 of the standard normal distribution table.
Click here to view page 2 of the standard normal distribution table.
Using the correlation coefficient of the normal probability plot, is it reasonable to conclude that the population is normally distributed? Select the correct choice below and fill in the answer boxes within your choice.
(Round to three decimal places as needed.)
O A. Yes. The correlation between the expected z-scores and the observed data,
exceeds the critical value,
Therefore, it is reasonable to conclude that the data come from a normal population.
O B. Yes. The correlation between the expected z-scores and the observed data,
exceeds the critical value.
Therefore, it is not reasonable to conclude that the data come from a normal population.
O C. No. The correlation between the expected z-scores and the observed data,
does not exceed the critical value,. Therefore, it is reasonable to conclude that the data come from a normal population.
O D. No. The correlation between the expected z-scores and the observed data,
does not exceed the critical value, Therefore, it is not reasonable to conclude that the data come from a normal population.

Transcribed Image Text:0.157 0.188 0.197 0.213
0.217 0.227 0.246 0.253
0.259 0.260 0.274 0.278
0.281 0.304 0.317 0.345
Expert Solution
This question has been solved!
Explore an expertly crafted, step-by-step solution for a thorough understanding of key concepts.

This is a popular solution

Trending nowThis is a popular solution!

Step by stepSolved in 2 steps with 1 images

Knowledge Booster

Similar questions
- USE TABLE A TO ANSWER QUESTIONS 1, 2, 3, and 4 BELOW. 1. Use Table A to find the PROPORTION of observations from a STANDARD NORMAL DISTRIBUTION that satisfy -2.46 < Z. O A. 9934 B. .9931 OC. 9940 OD. .9932 O E. 9936arrow_forwardC ,d,earrow_forwardSuppose a sample of O-rings was obtained and the wall thickness (in inches) of each was recorded. Use a normal probability plot to assess whether the sample data could have come from a population that is normally distributed.. Click here to view the table of critical values for normal probability plots Click here to view page 1 of the standard normal distribution table. Click here to view page 2 of the standard normal distribution table. 0.180 0.188 0.192 0.199 0.213 0.218 0.227 0.240 0.264 0.266 0.287 0.288 0.303 0.304 0.317 0.308 Using the correlation coefficient of the normal probability plot, is it reasonable to conclude that the population is normally distributed? Select the correct choice below and fill in the answer boxes within your choice. (Round to three decimal places as needed.) OA. Yes. The correlation between the expected z-scores and the observed data, data come from a normal population. OB. No. The correlation between the expected z-scores and the observed data, that…arrow_forward
- t X represent the full length of a certain species of newt. Assume that X has a normal probability distribution with mean 33.3 inches and standard deviation 5.6 inches.You intend to measure a random sample of n=174n=174 newts. The bell curve below represents the distibution of these sample means. The scale on the horizontal axis is the standard error of the sampling distribution. Complete the indicated boxes, correct to two decimal places.see the attachment also Note :- Please see the attachment , you have calculated only two items Please Find all thing . I have marked on red pen. Thanksarrow_forwardI need part barrow_forwardUse the standard normal distribution table to determine the percent of data between z= 1.06 and z= 1.53. Click here to view page 1 of the standard normal distribution table. Click here to view page 2 of the standard normal distribution table. O ..... The percent of data between z = 1.06 and z = 1.53 is (Round to two decimal places as needed.) %. %3D in ms Clear all Check answer Get more help- here to searcharrow_forward
- Just need part d.arrow_forwardFind the indicated z score. The graph depicts the standard normal distribution with mean 0 and standard deviation 1. Click to view page 1 of the table. LOADING... Click to view page 2 of the table. LOADING... z 0.9535 A graph with a bell-shaped curve, divided into 2 regions by a line from top to bottom on the right side. The region left of the line is shaded and is labeled 0.9535. Question content area bottom Part 1 The indicated z score is enter your response here. (Round to two decimal places as needed.)arrow_forwardThis is for statisticsarrow_forward
arrow_back_ios
SEE MORE QUESTIONS
arrow_forward_ios
Recommended textbooks for you
- MATLAB: An Introduction with ApplicationsStatisticsISBN:9781119256830Author:Amos GilatPublisher:John Wiley & Sons Inc
 Probability and Statistics for Engineering and th...StatisticsISBN:9781305251809Author:Jay L. DevorePublisher:Cengage Learning
 Statistics for The Behavioral Sciences (MindTap C...StatisticsISBN:9781305504912Author:Frederick J Gravetter, Larry B. WallnauPublisher:Cengage Learning
  Elementary Statistics: Picturing the World (7th E...StatisticsISBN:9780134683416Author:Ron Larson, Betsy FarberPublisher:PEARSON
 The Basic Practice of StatisticsStatisticsISBN:9781319042578Author:David S. Moore, William I. Notz, Michael A. FlignerPublisher:W. H. Freeman
 Introduction to the Practice of StatisticsStatisticsISBN:9781319013387Author:David S. Moore, George P. McCabe, Bruce A. CraigPublisher:W. H. Freeman
MATLAB: An Introduction with Applications
Statistics
ISBN:9781119256830
Author:Amos Gilat
Publisher:John Wiley & Sons Inc
Probability and Statistics for Engineering and th...
Statistics
ISBN:9781305251809
Author:Jay L. Devore
Publisher:Cengage Learning
Statistics for The Behavioral Sciences (MindTap C...
Statistics
ISBN:9781305504912
Author:Frederick J Gravetter, Larry B. Wallnau
Publisher:Cengage Learning
Elementary Statistics: Picturing the World (7th E...
Statistics
ISBN:9780134683416
Author:Ron Larson, Betsy Farber
Publisher:PEARSON
The Basic Practice of Statistics
Statistics
ISBN:9781319042578
Author:David S. Moore, William I. Notz, Michael A. Fligner
Publisher:W. H. Freeman
Introduction to the Practice of Statistics
Statistics
ISBN:9781319013387
Author:David S. Moore, George P. McCabe, Bruce A. Craig
Publisher:W. H. Freeman