
MATLAB: An Introduction with Applications
6th Edition
ISBN: 9781119256830
Author: Amos Gilat
Publisher: John Wiley & Sons Inc
expand_more
expand_more
format_list_bulleted
Related questions
Question
There are four questions on this prompt. Would you please answer them, for I am baffled. Thank you
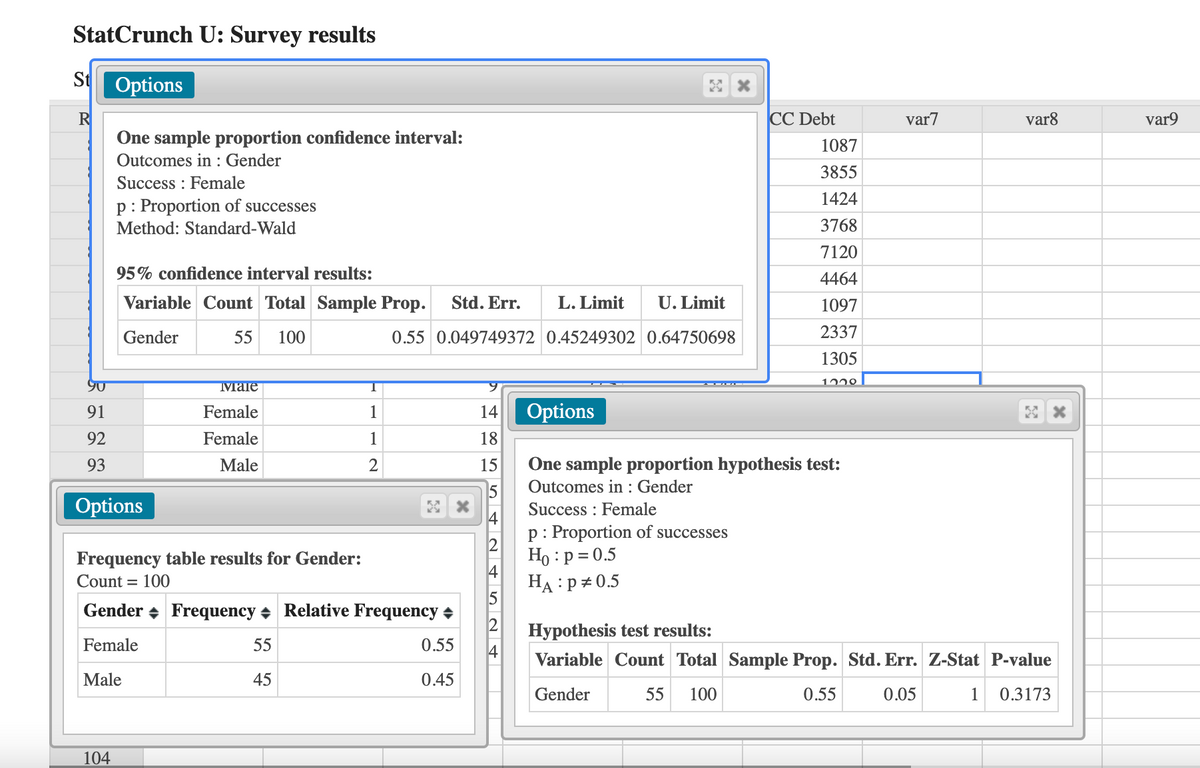

Transcribed Image Text:## Survey Results Analysis: StatCrunch U
### One Sample Proportion Confidence Interval
**Outcomes in:** Gender
**Success:** Female
**p:** Proportion of successes
**Method:** Standard-Wald
#### 95% Confidence Interval Results:
- **Variable:** Gender
- **Count:** 55
- **Total:** 100
- **Sample Prop.:** 0.55
- **Std. Err.:** 0.049749372
- **L. Limit:** 0.45249302
- **U. Limit:** 0.64750698
### Frequency Table Results for Gender
- **Count:** 100
- **Gender:**
- **Female:**
- **Frequency:** 55
- **Relative Frequency:** 0.55
- **Male:**
- **Frequency:** 45
- **Relative Frequency:** 0.45
### One Sample Proportion Hypothesis Test
**Outcomes in:** Gender
**Success:** Female
**p:** Proportion of successes
- **H₀:** p = 0.5
- **Hₐ:** p ≠ 0.5
#### Hypothesis Test Results:
- **Variable:** Gender
- **Count:** 55
- **Total:** 100
- **Sample Prop.:** 0.55
- **Std. Err.:** 0.05
- **Z-Stat:** 1
- **P-value:** 0.3173
---
This analysis provides an overview of the gender distribution in a sample of 100 individuals, focusing on the proportion of females. The confidence interval and hypothesis test results help determine if the observed proportion is significantly different from a hypothesized value.

Transcribed Image Text:**Unit 8 Lab**
For the Unit 8 lab, you will use a random sample of 100 students from a fictitious virtual population of 46,000 students at StatCrunch U.
**Instructions for accessing your data:**
- To access StatCrunch U, log into StatCrunch and click on Data Collectors.
You will see a student survey with 6 questions. This is a fictitious survey answered by the 46,000 fictitious students at StatCrunch U.
Below the survey, you can set the sample size. Set this to 100 and click "Generate Sample." A spreadsheet will appear with the survey results for your random sample of 100 StatCrunch U students.
**Note:** Your sample is a random sample; therefore, your results will differ somewhat from other students’ results.
**Instructions for the lab assignment:**
1. **Count Men and Women:**
- How many females are in your sample? How many males? What proportion of your sample is female? What proportion of your sample is male?
- **StatCrunch steps:** Stat, Tables, Frequency
2. **Proportion Hypothesis Test:**
- Is there an equal proportion of men and women at StatCrunch U?
a) Show that the conditions are met for using a normal model for a hypothesis test (np ≥ 10 and n(1 - p) ≥ 10, where p is from the null hypothesis).
b) Use StatCrunch to test the claim that the proportion of females is equal to the proportion of men. Paste the output.
**StatCrunch steps:** Stat, Proportion Stats, One Sample, With Data.
c) Write a conclusion based on your hypothesis test.
d) Explain the meaning of the P-value in this context (random samples of 100 StatCrunch U students).
3. **Confidence Interval:**
- What are the proportions of females and males at StatCrunch U?
a) Show the conditions are met for using a normal model (count of successes and failures are greater than 10).
b) Find a 95% confidence interval using StatCrunch. Paste the results.
**StatCrunch steps:** Stat, Proportion Stats, One Sample, With Data.
c) Interpret the interval regarding females.
d) Explain what is meant by “95% confident.”
4. **Supporting Hypothesis Test:**
- Does your confidence interval support your hypothesis test? Explain.
Expert Solution
This question has been solved!
Explore an expertly crafted, step-by-step solution for a thorough understanding of key concepts.

This is a popular solution

Trending nowThis is a popular solution!

Step by stepSolved in 2 steps with 2 images

Knowledge Booster

Similar questions
- Please help me answer the following questions. Thank youarrow_forwardMr. Imperfecto teaches another math class. This time he has 23 students take a test, the average score on which is an 87. Mr. Imperfecto realizes he put the wrong grade in for a student. He entered a 35, and the score should have been an 85. To the nearest integer, what is the new class average?arrow_forwardDr. Volz gave an exam with 14 questions, but students only had to answer 10 of them. Suppose the exam instructions say that either BOTH questions 1 and 2 may be included among the ten OR NEITHER is to be included. How many different choices of 10 questions are there?arrow_forward
arrow_back_ios
arrow_forward_ios
Recommended textbooks for you
- MATLAB: An Introduction with ApplicationsStatisticsISBN:9781119256830Author:Amos GilatPublisher:John Wiley & Sons Inc
 Probability and Statistics for Engineering and th...StatisticsISBN:9781305251809Author:Jay L. DevorePublisher:Cengage Learning
 Statistics for The Behavioral Sciences (MindTap C...StatisticsISBN:9781305504912Author:Frederick J Gravetter, Larry B. WallnauPublisher:Cengage Learning
  Elementary Statistics: Picturing the World (7th E...StatisticsISBN:9780134683416Author:Ron Larson, Betsy FarberPublisher:PEARSON
 The Basic Practice of StatisticsStatisticsISBN:9781319042578Author:David S. Moore, William I. Notz, Michael A. FlignerPublisher:W. H. Freeman
 Introduction to the Practice of StatisticsStatisticsISBN:9781319013387Author:David S. Moore, George P. McCabe, Bruce A. CraigPublisher:W. H. Freeman
MATLAB: An Introduction with Applications
Statistics
ISBN:9781119256830
Author:Amos Gilat
Publisher:John Wiley & Sons Inc
Probability and Statistics for Engineering and th...
Statistics
ISBN:9781305251809
Author:Jay L. Devore
Publisher:Cengage Learning
Statistics for The Behavioral Sciences (MindTap C...
Statistics
ISBN:9781305504912
Author:Frederick J Gravetter, Larry B. Wallnau
Publisher:Cengage Learning
Elementary Statistics: Picturing the World (7th E...
Statistics
ISBN:9780134683416
Author:Ron Larson, Betsy Farber
Publisher:PEARSON
The Basic Practice of Statistics
Statistics
ISBN:9781319042578
Author:David S. Moore, William I. Notz, Michael A. Fligner
Publisher:W. H. Freeman
Introduction to the Practice of Statistics
Statistics
ISBN:9781319013387
Author:David S. Moore, George P. McCabe, Bruce A. Craig
Publisher:W. H. Freeman