
MATLAB: An Introduction with Applications
6th Edition
ISBN: 9781119256830
Author: Amos Gilat
Publisher: John Wiley & Sons Inc
expand_more
expand_more
format_list_bulleted
Related questions
Question

Transcribed Image Text:Unit 3 Minitab
tcc.instructure.com
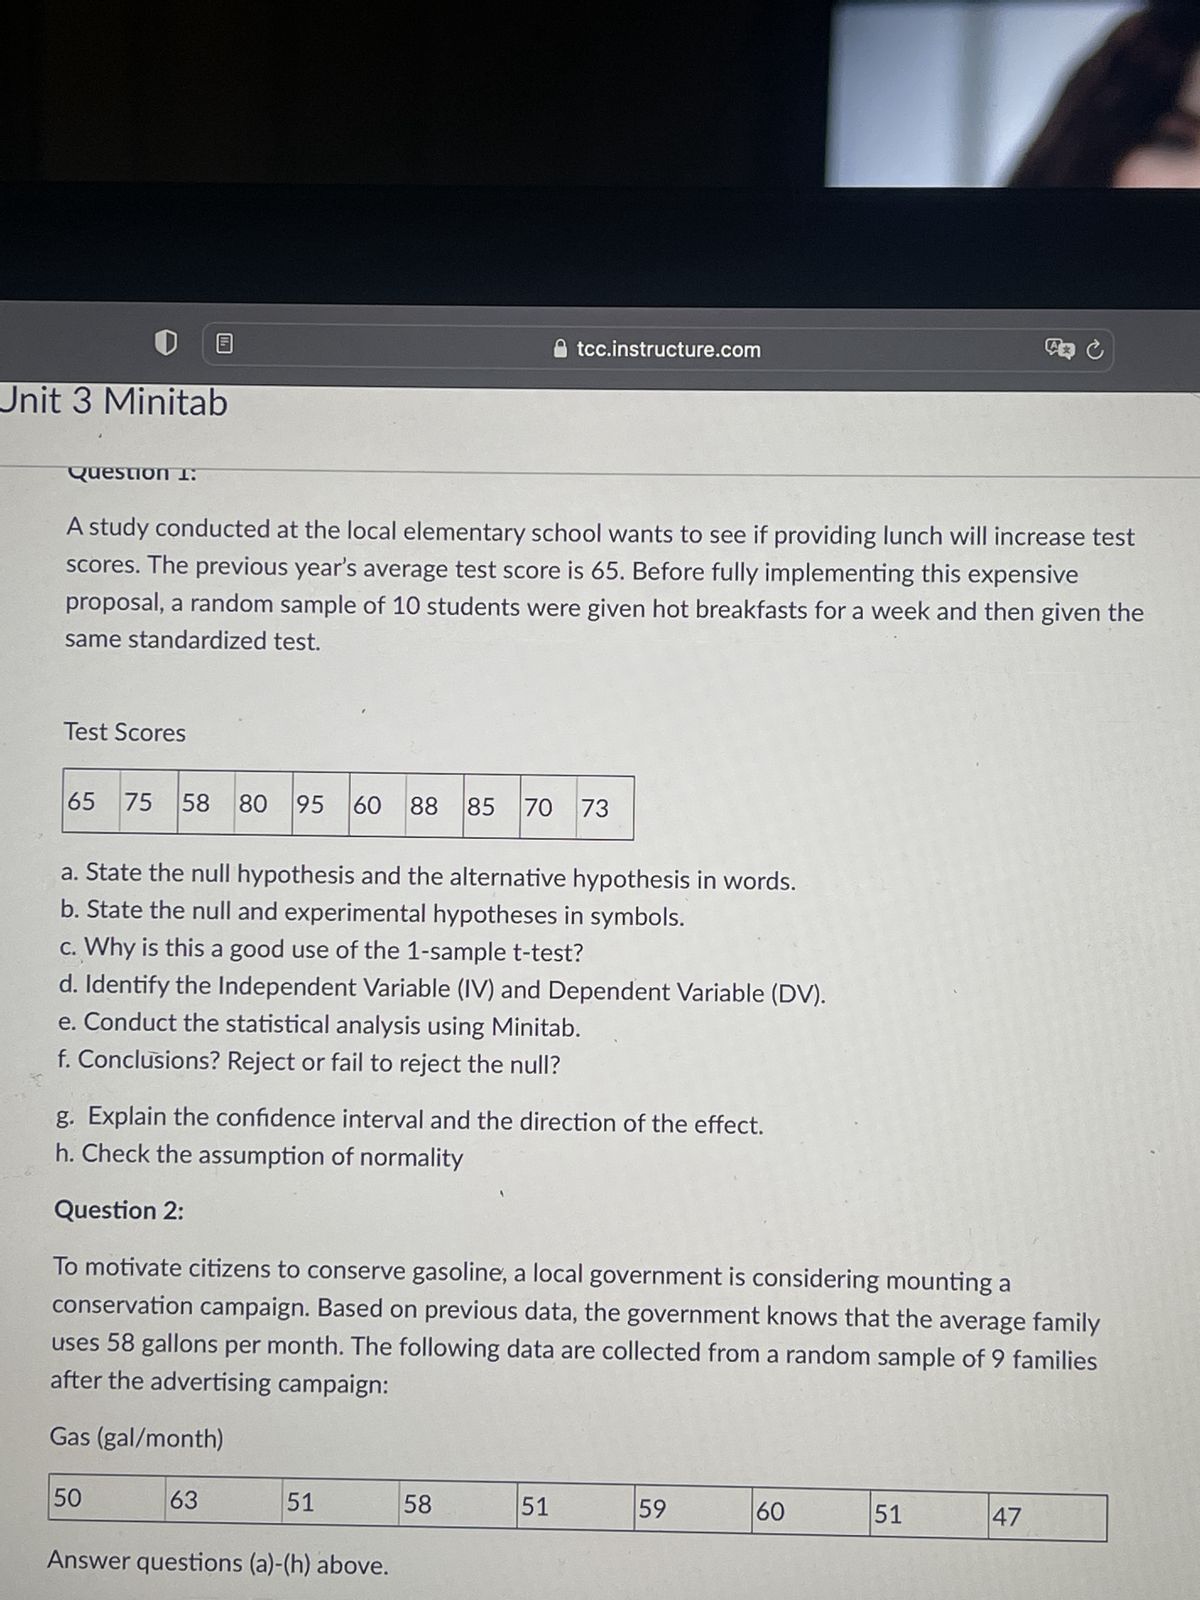
Question 1:
A study conducted at the local elementary school wants to see if providing lunch will increase test
scores. The previous year's average test score is 65. Before fully implementing this expensive
proposal, a random sample of 10 students were given hot breakfasts for a week and then given the
same standardized test.
Test Scores
65 75 58 80 95
95 60
60 88 85 70 73
a. State the null hypothesis and the alternative hypothesis in words.
b. State the null and experimental hypotheses in symbols.
c. Why is this a good use of the 1-sample t-test?
d. Identify the Independent Variable (IV) and Dependent Variable (DV).
e. Conduct the statistical analysis using Minitab.
f. Conclusions? Reject or fail to reject the null?
g. Explain the confidence interval and the direction of the effect.
h. Check the assumption of normality
Question 2:
To motivate citizens to conserve gasoline, a local government is considering mounting a
conservation campaign. Based on previous data, the government knows that the average family
uses 58 gallons per month. The following data are collected from a random sample of 9 families
after the advertising campaign:
Gas (gal/month)
50
63
51
58
51
59
60
51
47
Answer questions (a)-(h) above.
Expert Solution
This question has been solved!
Explore an expertly crafted, step-by-step solution for a thorough understanding of key concepts.

Step by stepSolved in 6 steps with 14 images

Knowledge Booster

Similar questions
- Subject: Mathematicsarrow_forwardI need help with question 2 plz.arrow_forwardYou are management for a chain of department stores. Your analytics team believes that the proportion of months with lost sales for one of your department stores is 25%. You believe it is higher than this, so you gather some data for the last 4 years. You find that for 48 months there were 17 months where there were lost sales. Do you have enough evidence to doubt your analytics team? a) What is the null hypothesis? b) What is the alternative hypothesis? c) What is the claimed population proportion? d) What is the sample proportion (called the test statistic) e) What is the std deviation f) What is the z-value of the test statistic? g) What is the p-value h) What is the conclusion in wordsarrow_forward
- A researchers claims 45% of couples have children. They conduct a hypothesis test and reject the null hypothesis. What type of error could have been committed here? Type 1, type 2, or power if the test?arrow_forwardYou are conducting a study to see if the proportion of voters who prefer the Democratic candidate is significantly different from 72% at a level of significance of a = 0.10. According to your sample, 63 out of 83 potential voters prefer the Democratic candidate. a. For this study, we should use Select an answer b. The null and alternative hypotheses would be: Ho: v Select an answer v (please enter a decimal) H1: ? v Select an answer v (Please enter a decimal) c. The test statistic ? v = (please show your answer to 3 decimal places.) d. The p-value = (Please show your answer to 4 decimal places.) e. The p-value is ? v a f. Based on this, we should Select an answer v the null hypothesis. g. Thus, the final conclusion is that ... O The data suggest the population proportion is not significantly different from 72% at a = 0.10, so there is not sufficient evidence to conclude that the proportion of voters who prefer the Democratic candidate is different from 72%. O The data suggest the…arrow_forwardCan you help me determine the test statistic, the P-value, and the conclusion for this hypothesis test?arrow_forward
- A company is evaluating the knowledge retention of their fiscal policy training program by administering a quiz to a randomly selected sample of 16 employees both one week after completing training and 6 months after completing the training. Employee scores are shown in the Excel file. Has there been a significant reduction in knowledge of the fiscal policy six months after completing training? State the five hypothesis testing steps to answer this question. Employee 1 2 3 45 6 7 8 9 10 0 12 3 4 5 6 11 13 14 15 16 One week after 69 80 73 100 100 50 77 64 94 100 100 100 100 47 67 63 Six months after 70 79 77 97 95 50 60 64 84 90 80 99 94 57 58 68arrow_forward. It is estimated that about 5% of the professors at Metro State University use illegaldrugs. Suppose random drug testing is instituted by state law. The drug test used hascertain error rates: 6% of the drug users receive a (false) negative test result, and 4% ofthe non-drug users receive a (false) positive test result. If they test me next week and thetest result comes back positive, how likely is it that I actually do use illegal drugs?arrow_forwardQUESTION 8 A social psychologist gave a questionnaire about concern for farm workers to seven participants before and after they attended a film about union organization of farm workers to determine whether the film affected their level of concern. Which of the following hypothesis tests would be most appropriate given this scenario? O single-sample t-test independent sample t-test O dependent sample t-test Oz-testarrow_forward
arrow_back_ios
arrow_forward_ios
Recommended textbooks for you
- MATLAB: An Introduction with ApplicationsStatisticsISBN:9781119256830Author:Amos GilatPublisher:John Wiley & Sons Inc
 Probability and Statistics for Engineering and th...StatisticsISBN:9781305251809Author:Jay L. DevorePublisher:Cengage Learning
 Statistics for The Behavioral Sciences (MindTap C...StatisticsISBN:9781305504912Author:Frederick J Gravetter, Larry B. WallnauPublisher:Cengage Learning
  Elementary Statistics: Picturing the World (7th E...StatisticsISBN:9780134683416Author:Ron Larson, Betsy FarberPublisher:PEARSON
 The Basic Practice of StatisticsStatisticsISBN:9781319042578Author:David S. Moore, William I. Notz, Michael A. FlignerPublisher:W. H. Freeman
 Introduction to the Practice of StatisticsStatisticsISBN:9781319013387Author:David S. Moore, George P. McCabe, Bruce A. CraigPublisher:W. H. Freeman
MATLAB: An Introduction with Applications
Statistics
ISBN:9781119256830
Author:Amos Gilat
Publisher:John Wiley & Sons Inc
Probability and Statistics for Engineering and th...
Statistics
ISBN:9781305251809
Author:Jay L. Devore
Publisher:Cengage Learning
Statistics for The Behavioral Sciences (MindTap C...
Statistics
ISBN:9781305504912
Author:Frederick J Gravetter, Larry B. Wallnau
Publisher:Cengage Learning
Elementary Statistics: Picturing the World (7th E...
Statistics
ISBN:9780134683416
Author:Ron Larson, Betsy Farber
Publisher:PEARSON
The Basic Practice of Statistics
Statistics
ISBN:9781319042578
Author:David S. Moore, William I. Notz, Michael A. Fligner
Publisher:W. H. Freeman
Introduction to the Practice of Statistics
Statistics
ISBN:9781319013387
Author:David S. Moore, George P. McCabe, Bruce A. Craig
Publisher:W. H. Freeman