
Related questions
Understanding Discrete and Continuous Random Variables in Hydrology
(a) List at least five examples of hydrologic discrete variables and five hydrologic continuous variables. Discuss and/or explain and how and/or why these variables in each category qualify the stated variables?
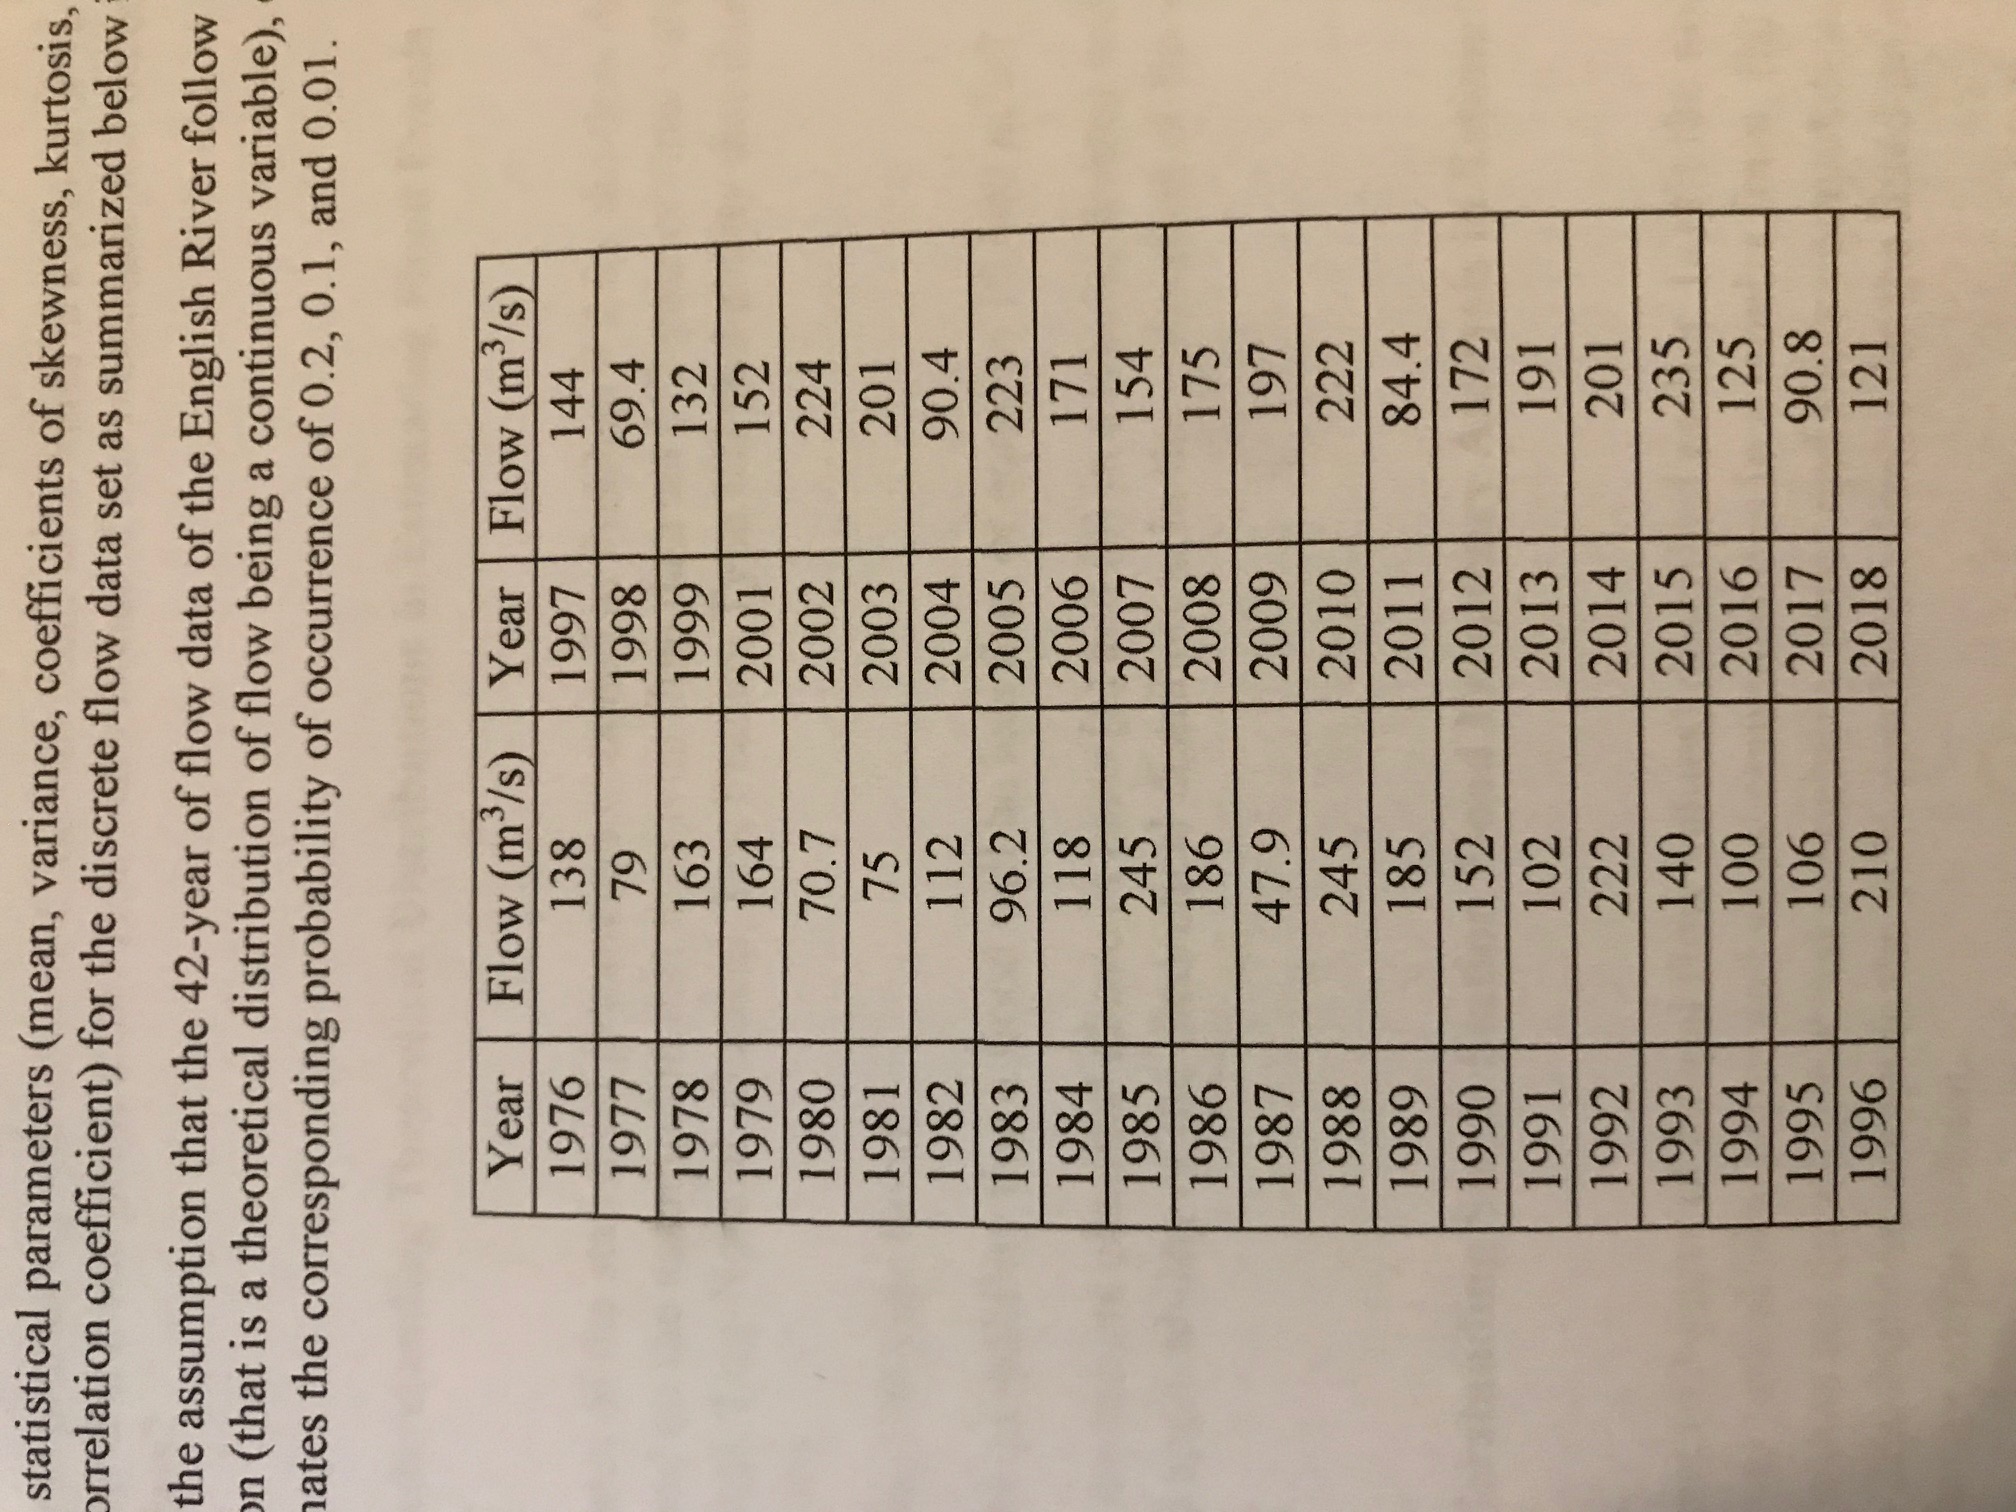
(b) For the English River with watershed area 6230 km2and located in Thunder Bay district of Northwestern Ontario, find the
(c) Compute statistical parameters (mean, variance, coefficients of skewness, kurtosis, variation, and the lag one
(d) Based on the assumption that the 42-year of flow data of the English River follow a


Trending nowThis is a popular solution!

Step by stepSolved in 2 steps


- A student has taken 4 area exams designed to measure particular intellectual abilities. The following table identifies each test, summarizes its characteristics, and provides the student’s score on it. Assume that the possible scores on each test are normally distributed. Area Test ? ? Student’s Score Verbal Ability 58.50 6.50 63.00 Visualization 110.00 15.00 102.50 Memory 85.00 11.50 98.00 Spatial Relations 320.00 33.50 343.00 a. Change each student’s score to its z-score equivalent b. On which test did the student score in the highest position? c. On which test did the student score in the lowest position? d. What is the percentile rank of the student’s Verbal Ability? e. What percentage of the students who took the Spatial Relations test scored higher than the student? f. Between what two scores on Memory did the middle 95% of students lie? g. What percent of students had scores between X = 95 and X = 110 on Visualization?arrow_forwardLearning math Developers of a new math curriculumcalled “Accelerated Math” compared performances ofstudents taught by their system with control groups ofstudents in the same schools who were taught using traditional instructional methods and materials. Statis-tics about pretest and posttest scores are shown in the table. (J. Ysseldyke and S. Tardrew, Differentiating MathInstruction, Renaissance Learning, 2002)a) Did the groups differ in average math score at thestart of this study? b) Did the group taught using the Accelerated Math pro-gram show a significant improvement in test scores? c) Did the control group show a significant improve-ment in test scores? d) Were gains significantly higher for the AcceleratedMath group than for the control group? Instructional MethodAcc. math ControlNumber of students 231 245Pretest Mean 560.01 549.65St. Dev 84.29 74.68Post-test Mean 637.55 588.76St. Dev 82.9 83.24Individual gain Mean 77.53 39.11St. Dev. 78.01 66.25arrow_forwardc and d pleasearrow_forward
- A study is performed to assess the prevalence of use of anti-hypertensive medication (MEDS) in the non-institutionalized U.S. population. The following data are reported for MEDS status of the U.S. population by age-sex group: Table 1 Estimated MEDS Status of the U.S. Population by age and sex group, NHANES study 1999-2018 Males Females Age Group MEDS = yes Na Age Group MEDS = yes Na 18-29 160,617 23,069,867 18-29 168,940 22,132,949 30-39 899,152 18,690,754 30-39 759,532 18,937,878 40-49 2,264,304 18,316,125 40-49 2,257,203 18,816,304 50-59 3,215,688 15,022,905 50-59 4,059,363 15,997,653 60-69 2,936,183 8,400,156 60-69 4,260,975 10,993,805 70-79 1,677,664 4,012,930 70-79 2,953,646 6,012,728 aN = total sample size in specific age-sex groups. a. What is the prevalence of use of MEDS in 40-49 year-old females? b. Suppose a married couple consists…arrow_forwardThe racial/ethnic diversity of post high school students enrolled at MVCC during the fall 2020 semester is given below. Racial/Ethnic Diversity of Post High School Students Race/Ethnicity Percent* American Indian or Alaska Native 0.4% Asian 5.3% Black or African American 9.6% Hispanic or Latino 9.6% Two or more races 2.8% Native Hawaiian or Pacific Islander <0.1% Non-Resident Alien 0.5% Unknown 1.5% White 70.2% (*Percentages may not total 100 due to rounding) What is the race/ethnicity of the majority of students at MVCC? What total percent of students were either Black or African American or Hispanic or Latino? There were 3,444 students enrolled at MVCC at the time of the study. How many (not percent) students were Asian? (The answer must be a whole number.)arrow_forwardThe data to the right represent the number of chocolate chips per cookie in a random sample of a name brand and a store brand. Complete parts (a) to (c) below. Full data set D Name Brand Store Brand 20 23 26 24 28 19 21 27 33 28 33 15 29 22 25 17 22 21 22 30 20 26 23 24 25 27 ... (a) Draw side-by-side boxplots for each brand of cookie. Label the boxplots "N" for the name brand and "S" for the store brand. Choose the correct answer below. OA. OB. OC. N- N- N- 10 20 30 40 10 20 30 40 10 20 30 40 (b) Does there appear to be a difference in the number of chips per cookie? O A. Yes. The store brand appears to have more chips per cookie. O B. No. There appears to be no difference in the number of chips per cookie. O C. Yes. The name brand appears to have more chips per cookie. O D. There is insufficient information to draw a conclusion. (c) Does one brand have a more consistent number of chips per cookie? O A. No. Both brands have roughly the same number of chips per cookie. O B. Yes. The…arrow_forward
- The more costly and time-consuming it is to export and import, the more difficult it is for local companies to be competitive and to reach international markets. As part of an initial investigation exploring foreign market entry, 9 countries were selected from each of four global regions. The cost associated with importing a standardized cargo of goods by sea transport in these countries (in US$ per container) is stored in the accompanying data table. Complete parts (a) through (d). East Asia & Pacific Eastern Europe & Central Asia Latin America & Caribbean Middle East & North Africa240 77 1200 466777 335 688 397266 396 970 554383 83 290 644580 150 545 181220 306 420 646389 1125 450 695233 655 583 754392 100 1500 779 c. At the 0.05 level of significance, is there evidence of a difference in the variation in cost of importing among the four global regions? Determine…arrow_forwardA Journal published longitudinal study of hearing impairment in a group of elderly patients with intellectual disabilities. The hearing function of each patient was screened each year over a 10 - year period. At the study's conclusion, the hearing loss of each patient was categorized as severe, moderate, mild, or none. The classification of the 28 surviving patients are summarized in the following table. Hearing loss Number of Patients None 7 Mild 7 Moderate 9 Severe 5 Total 28 Conduct a test to determine whether the trueproportions of intellectually disabled elderly patients in each ofthe hearing-loss categories differ. Use a 5% significance level. We are doing this on a Ti84 plus Calculator.arrow_forwardPETROGAS is testing new filters for its motorbikes. One brand of filter (Filter A) is placed in one motorbike, and the other brand (Filter B) is placed in the second motorbike. Random samples of air released from the motorbikes are taken at different times throughout the day. Pollutant concentrations are measured for both motorbikes at the same time. The following data attached represent the pollutant concentrations (in parts per million) for samples taken at 20 different times after passing through the filters. a. Test the hypothesis that the mean for the pollutant concentration for Filter B is greater than 30. Use the 1% level of significance. b. Construct a 95% confidence interval for the difference in mean pollutant concentration, where a difference is equal to the pollutant concentration passing through Filter A minus the passing through Filter B. c. Using the 5% significance level, determine whether there is evidence that mean for the pollutant concentration for Filter A…arrow_forward
- The racial/ethnic diversity of post high school students enrolled at MVCC during the fall 2020 semester is given below. Racial/Ethnic Diversity of Post High School Students Race/Ethnicity Percent* American Indian or Alaska Native 0.4% Asian 5.3% Black or African American 9.6% Hispanic or Latino 9.6% Two or more races 2.8% Native Hawaiian or Pacific Islander <0.1% Non-Resident Alien 0.5% Unknown 1.5% White 70.2% (*Percentages may not total 100 due to rounding) Is race/ethnicity a qualitative or quantitative variable Is the data displayed in a frequency or relative frequency distribution?arrow_forwardHow are the data search the same? How do they differ? A.) The three data sets have the same mean and mode but have different medians and standard deviations. B.) The three data sets have the same standard deviations but have different means. C.) The three data sets have the same mean, median and mode but have different standard deviations. D.) The three data sets have the same mode but have different standard deviations and means.arrow_forward2, For the three clusters identified in the accompanying Distance Matrix After Second Clustering table, find the average and standard deviations of each numerical variable for the schools in each cluster and compare them with the average and standard deviation for the entire data set. Does the clustering show distinct differences among these clusters? Compute the overall mean and overall standard deviation for each numerical variable. Median SAT Acceptance Rate Expenditures /Student Top 10% HS Graduation % Overall Mean enter your response here enter your response here% $enter your response here enter your response here enter your response here Overall Stdev enter your response here enter your response here% $enter your response here enter your response here enter your response here (Round to two decimal places as needed. Type N if the solution is undefined.) Colleges and Universities School…arrow_forward
- MATLAB: An Introduction with ApplicationsStatisticsISBN:9781119256830Author:Amos GilatPublisher:John Wiley & Sons Inc
 Probability and Statistics for Engineering and th...StatisticsISBN:9781305251809Author:Jay L. DevorePublisher:Cengage Learning
 Statistics for The Behavioral Sciences (MindTap C...StatisticsISBN:9781305504912Author:Frederick J Gravetter, Larry B. WallnauPublisher:Cengage Learning
  Elementary Statistics: Picturing the World (7th E...StatisticsISBN:9780134683416Author:Ron Larson, Betsy FarberPublisher:PEARSON
 The Basic Practice of StatisticsStatisticsISBN:9781319042578Author:David S. Moore, William I. Notz, Michael A. FlignerPublisher:W. H. Freeman
 Introduction to the Practice of StatisticsStatisticsISBN:9781319013387Author:David S. Moore, George P. McCabe, Bruce A. CraigPublisher:W. H. Freeman