MATLAB: An Introduction with Applications
6th Edition
ISBN: 9781119256830
Author: Amos Gilat
Publisher: John Wiley & Sons Inc
expand_more
expand_more
format_list_bulleted
Question

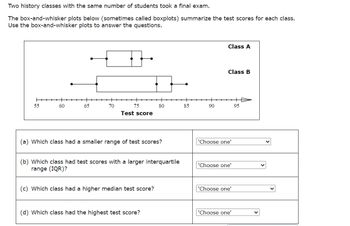
Transcribed Image Text:Two history classes with the same number of students took a final exam.
The box-and-whisker plots below (sometimes called boxplots) summarize the test scores for each class.
Use the box-and-whisker plots to answer the questions.
Class A
Class B
55
60
65
70
75
80
85
90
95
Test score
(a) Which class had a smaller range of test scores?
'Choose one'
(b) Which class had test scores with a larger interquartile
range (IQR)?
'Choose one'
(c) Which class had a higher median test score?
'Choose one'
(d) Which class had the highest test score?
'Choose one'
Expert Solution
This question has been solved!
Explore an expertly crafted, step-by-step solution for a thorough understanding of key concepts.
Step by stepSolved in 2 steps with 1 images

Knowledge Booster
Similar questions
- Last two subpart pleasearrow_forwardGradeboo t Content The data to the right shows the number of graduating students with business majors at a university over the last 15 275 269 263 257 Scor years. 249 242 236 231 1009 a Construct a box-and-whisker plot for this data. b. Identify the five-number summary. 223 216 210 204 y Plan 199 193 187 o & Resou 91.33% ary a) Choose the correct box-and-whisker plot of the data below. O B. OC. essible Res O A. 94.85% -chase Opti past due 250 300 mmunicati 150 200 150 200 250 300 150 200 250 300 b) The five-number summary is (Use ascending order.)arrow_forwardHello! I need help with this particular question on my study guide. There is an attachment below. Thank you!arrow_forward
- (a) Find the five-number summary, and (b) draw a box-and-whisker plot of the data. 3 88 5 2 9 8 79 5 9 3 2 6 2 9 8 779 (a) Min = (Simplify your answer.) Q, = (Simplify your answer. Do not round.) Q2 (Simplify your answer. Do not round.) Q3 = (Simplify your answer. Do not round.) Max = (Simplify your answer.) (b) Choose the correct box-and-whisker plot below. OA. В. C. O D. 2 8. 2 4 8. 2 4 4 6. Foarrow_forwardHere is a data set: 33 67 53 42 31 67 41 47 41 42 44 45 34 49 64 30 48 41 51 34 46 39 53 32 52 43 31 49 43 55 You are examining the data with a stem-and-leaf plot. Here is the start of the plot. Finish the plot.3# | 011234494# | 111223345678995# | 123356# |arrow_forwardHere is a data set: 73 59 78 40 55 | 43 46 55 67 56 45 54 63 57 54 57 58 48 61 49 57 59 55 65 63 46 74 42 55 53 You are examining the data with a stem-and-leaf plot. Here is the start of the plot. Finish the plot. 4# | 02356689 5# | 34455556777899 6# | 13357 7# |arrow_forward
- Here is a data set: 42 42 51 58 35 47 41 37 41 55 40 53 43 49 45 53 35 47 52 43 You are examining the data with a split stem-and-leaf plot. Here is the start of the plot: 3 | 557 4 | 0112233 4 | 5779 5|| 5 | What should be entered in the last row of this table? 5|arrow_forwardTwo algebra classes with the same number of students took a final exam. The box-and-whisker plots below (sometimes called boxplots) summarize the test scores for each class. Use the box-and-whisker plots to answer the questions. Class A Class B ++D 95 55 60 65 70 75 80 85 90 Test score (a) Which class had the highest test score? 'Choose one' (b) Which class had test scores with a larger interquartile range (IQR)? "Choose one' (c) Which class had a higher median test score? 'Choose one' (d) A score above 70 is considered passing. Which class had 'Choose one' more passing scores?arrow_forwardHere is a data set: 49 47 33 40 68 40 57 30 55 31 46 39 48 37 39 68 64 40 49 59 49 41 36 55 46 31 58 42 45 41 You are examining the data with a stem-and-leaf plot. Here is the start of the plot. Finish the plot. 3| 01136799 4| 00011256678999 5| 55789 6 |arrow_forward
arrow_back_ios
arrow_forward_ios
Recommended textbooks for you
 MATLAB: An Introduction with ApplicationsStatisticsISBN:9781119256830Author:Amos GilatPublisher:John Wiley & Sons Inc
 Probability and Statistics for Engineering and th...StatisticsISBN:9781305251809Author:Jay L. DevorePublisher:Cengage Learning
 Statistics for The Behavioral Sciences (MindTap C...StatisticsISBN:9781305504912Author:Frederick J Gravetter, Larry B. WallnauPublisher:Cengage Learning
 Elementary Statistics: Picturing the World (7th E...StatisticsISBN:9780134683416Author:Ron Larson, Betsy FarberPublisher:PEARSON
 The Basic Practice of StatisticsStatisticsISBN:9781319042578Author:David S. Moore, William I. Notz, Michael A. FlignerPublisher:W. H. Freeman
 Introduction to the Practice of StatisticsStatisticsISBN:9781319013387Author:David S. Moore, George P. McCabe, Bruce A. CraigPublisher:W. H. Freeman

MATLAB: An Introduction with Applications
Statistics
ISBN:9781119256830
Author:Amos Gilat
Publisher:John Wiley & Sons Inc

Probability and Statistics for Engineering and th...
Statistics
ISBN:9781305251809
Author:Jay L. Devore
Publisher:Cengage Learning

Statistics for The Behavioral Sciences (MindTap C...
Statistics
ISBN:9781305504912
Author:Frederick J Gravetter, Larry B. Wallnau
Publisher:Cengage Learning

Elementary Statistics: Picturing the World (7th E...
Statistics
ISBN:9780134683416
Author:Ron Larson, Betsy Farber
Publisher:PEARSON

The Basic Practice of Statistics
Statistics
ISBN:9781319042578
Author:David S. Moore, William I. Notz, Michael A. Fligner
Publisher:W. H. Freeman

Introduction to the Practice of Statistics
Statistics
ISBN:9781319013387
Author:David S. Moore, George P. McCabe, Bruce A. Craig
Publisher:W. H. Freeman