
MATLAB: An Introduction with Applications
6th Edition
ISBN: 9781119256830
Author: Amos Gilat
Publisher: John Wiley & Sons Inc
expand_more
expand_more
format_list_bulleted
Related questions
Question
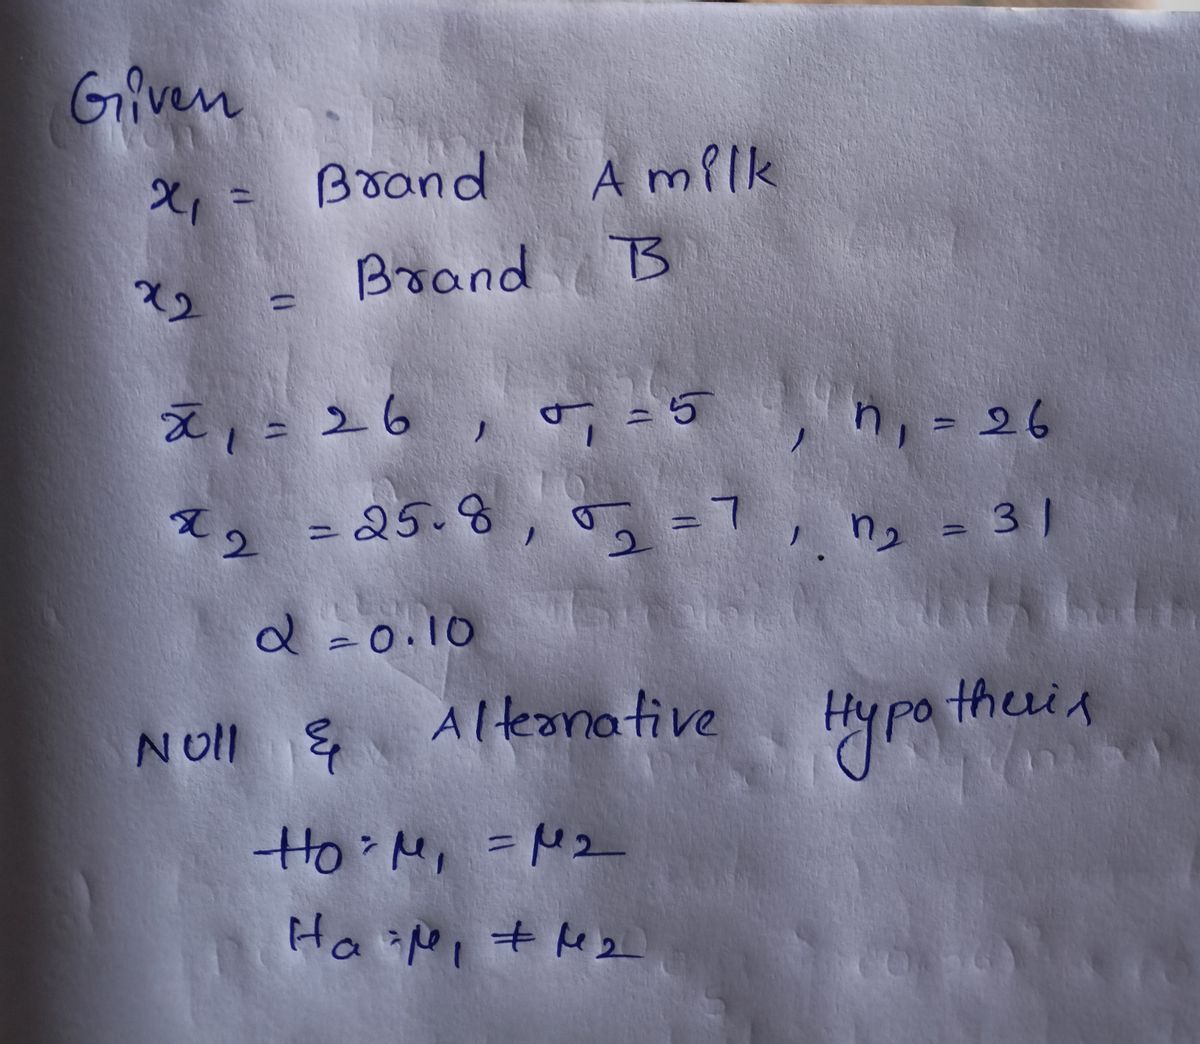
Two different brands of milk are randomly sampled, and the fat content in each bottle is determined. Twenty-six bottles of Brand A yielded an average fat content of 26 grams with a standard deviation of 5 grams, and 31 bottles of Brand B yielded an average fat content of 25.8 grams with a standard deviation of 7 grams. Test the hypothesis at the 10% level of significance that the variances are different.


Transcribed Image Text:6) Two different brands of milk are randomly sampled, and the fat content in each bottle
of milk is determined. Twenty six bottles of Brand A yielded an average fat content
of 26 grams with a standard deviation of 5 grams, and 31 bottles of Brand B yielded
an average fat content of 25.8 grams with a standard deviation of 7 grams. Test the
hypothesis at the 10% level of significance that the variances are different.
Expert Solution
arrow_forward
Step 1

Trending nowThis is a popular solution!

Step by stepSolved in 2 steps with 2 images

Knowledge Booster

Similar questions
- An educator has developed a program to improve math scores on the Texas STAAR test. The average STAAR Mathematics test for the third graders in the district was a mean= 1472. A sample of n= 30 third graders took the new math training prgram before taking the STAAR Math test. The average score for the students was M= 1497. with a standard deviation of s= 145 (note, this is standard deviation, not variance). Was there a significant change in test scores ( use stard devistion of 0.05, two tail test). Calculate the effect size using Cohen's d.arrow_forwardA paint manufacturer wants to introduce a new paint on the market. The following data were obtained for drying time (minutes) when five samples of the paint were tested. 380 290 240 310 300 Assuming that the drying time is normally distributed with a variance of 400, obtain a 99% confidence interval for the true mean drying time.arrow_forwardA study has been made to compare the nicotine contents of two brands of cigarettes. Ten cigarettes of Brand A had an average nicotine content of 4.3 milligrams with a standard deviation of 0.6 milligram. Eight cigarettes of Brand B had an average nicotine content of 3 milligrams with a standard deviation of 0.4 milligram. Assume that the two sets of data are independent random samples from normal populations with equal variances. Answer the following, and round off your answer to three decimal places. (a) Find a pooled estimate of the population standard deviation. (b) Construct a 95% confidence interval for the difference between the mean nicotine contents of the two brands of cigarettes. (☐☐)arrow_forward
- Bone mineral density (BMD) is a measure of bone strength. Studies show that BMD declines after age 45. The impact of exercise may increase BMD. A random sample of 59 women between the ages of 41 and 45 with no major health problems were studied. The women were classified into one of two groups based upon their level of exercise activity: walking women and sedentary women. The 39 women who walked regularly had a mean BMD of 5.96 with a standard deviation of 1.22. The 20 women who are sedentary had a mean BMD of 4.41 with a standard deviation of 1.02. Which of the following inference procedures could be used to estimate the difference in the mean BMD for these two types of womenarrow_forwardThe mean tar content of a simple random sample of 25 unfiltered king-size cigarettes is 21.4 mg, with a standard deviation of 3 mg. The mean tar content of a simple random sample of 25 filtered 100-mm cigarettes is 13.0 mg with a standard deviation of 3.8 mg. The accompanying table shows the data. Assume that the two samples are independent simple random samples selected from normally distributed populations, and do not assume that the population standard deviations are equal. Let population 1 be unfiltered king-size cigarettes. Complete parts (a) through (c) below. Click the icon to view the data. a. Use a 0.05 significance level to test the claim that unfiltered king-size cigarettes have a mean tar content greater than that of filtered 100-mm cigarettes. What does the result suggest about the effectiveness of cigarette filters? Identify the null and alternative hypotheses. O B. Ho: H1 =H2 O C. Ho: H1 #H2 H1: H1 =H2 O A. Ho: H1 = H2 H:H1 H2 O F. Ho: H1 = H2 H1:H1> H2 H:H1=H2 Hq: H1…arrow_forwardA researcher was interested in knowing if mean BMI was different between males and females. He obtained the following test results. Choose the correct interpretation of the results: F test p value = 0.30 Two sample t test, assume equal variance = 0.02 Two sample t test, assume unequal variance = 0.61 Mean BMI is not significantly different between males and females. None Mean BMI is higher in males than females. Mean BMI is significantly different between males and females.arrow_forward
- An engineer designed a valve that will regulate water pressure on an automobile engine. The engineer designed the valve such that it would produce a mean pressure of 5.5 pounds/square inch. It is believed that the valve performs above the specifications. The valve was tested on 24 engines and the mean pressure was 5.7 pounds/square inch with a variance of 0.49. A level of significance of 0.01 will be used. Assume the population distribution is approximately normal. Make the decision to reject or fail to reject the null hypothesis.arrow_forwardAn intercity bus company is attempting to improve the reliability of its service. One manager claims that the variability (i.e., standard deviation) in arrivals from the posted schedule at the central bus depot is approximately 3 minutes. Another manager disagrees, suspecting that the spread in times of arrival is different. Using variance, what is the population parameter under consideration? What hypotheses should the managers test in this situation?arrow_forwardA researcher decides to measure anxiety in group of bullies and a group of bystanders using a 23-item, 3 point anxiety scale. Assume scores on the anxiety scales are normally distributed and the variance among the group of bullies and bystanders are the same. A group of 30 bullies scores an average of 21.5 with a sample standard deviation of 10 on the anxiety scale. A group of 27 bystanders scored an average of 25.8 with a sample standard deviation of 8 on the anxiety scale. You do not have any presupposed assumptions whether bullies or bystanders will be more anxious so you formulate the null and alternative hypothesis based on that.arrow_forward
- A basketball coach believes that the variance of the heights of adult male basketball players is different from the variance of heights for the general population of men. The sample variance of heights, measured in inches, for a random sample of 19 basketball players is 14.22. The sample variance for a random sample of 18 other men is 34.49. Assume that both population distributions are approximately normal and test the coach’s claim using a 0.10 level of significance. Does the evidence support the coach’s claim? Let male basketball players be Population 1 and men in general be Population 2. Step 1 of 3: State the null and alternative hypotheses for the test. Fill in the blank below. H0: σ21=σ22: Ha: σ21⎯⎯⎯⎯⎯⎯⎯⎯⎯⎯⎯⎯⎯⎯⎯σ22 Step 2 of 3: Compute the value of the test statistic. Round your answer to four decimal places. Step 3 of 3: Draw a conclusion and interpret the decision.arrow_forwardThe salaries of professional baseball players are heavily skewed right with a mean of $3.2 million and a standard deviation of $2 million. The salaries of professional football players are also heavily skewed right with a mean of $1.9 million and a standard deviation of $1.5 million. A random sample of 40 baseball players’ salaries and 35 football players’ salaries is selected. The mean salary is determined for both samples. Let represent the difference in the mean salaries for baseball and football players. Which of the following represents the shape of the sampling distribution for ? skewed right since the populations are both right skewed skewed right since the differences in salaries cannot be negative approximately Normal since both sample sizes are greater than 30 approximately Normal since the sum of the sample sizes is greater than 30arrow_forwardAn automobile manufacturer has given its van a 50.6 miles/gallon (MPG) rating. An independent testing firm has been contracted to test the actual MPG for this van since it is believed that the van has an incorrect manufacturer's MPG rating. After testing 220 vans, they found a mean MPG of 50.5. Assume the population variance is known to be 1.69. A level of significance of 0.01 will be used. Find the P-value of the test statistic. you may write the P-value as a range using interval notation, or as a decimal value rounded to four decimal places.arrow_forward
arrow_back_ios
arrow_forward_ios
Recommended textbooks for you
- MATLAB: An Introduction with ApplicationsStatisticsISBN:9781119256830Author:Amos GilatPublisher:John Wiley & Sons Inc
 Probability and Statistics for Engineering and th...StatisticsISBN:9781305251809Author:Jay L. DevorePublisher:Cengage Learning
 Statistics for The Behavioral Sciences (MindTap C...StatisticsISBN:9781305504912Author:Frederick J Gravetter, Larry B. WallnauPublisher:Cengage Learning
  Elementary Statistics: Picturing the World (7th E...StatisticsISBN:9780134683416Author:Ron Larson, Betsy FarberPublisher:PEARSON
 The Basic Practice of StatisticsStatisticsISBN:9781319042578Author:David S. Moore, William I. Notz, Michael A. FlignerPublisher:W. H. Freeman
 Introduction to the Practice of StatisticsStatisticsISBN:9781319013387Author:David S. Moore, George P. McCabe, Bruce A. CraigPublisher:W. H. Freeman
MATLAB: An Introduction with Applications
Statistics
ISBN:9781119256830
Author:Amos Gilat
Publisher:John Wiley & Sons Inc
Probability and Statistics for Engineering and th...
Statistics
ISBN:9781305251809
Author:Jay L. Devore
Publisher:Cengage Learning
Statistics for The Behavioral Sciences (MindTap C...
Statistics
ISBN:9781305504912
Author:Frederick J Gravetter, Larry B. Wallnau
Publisher:Cengage Learning
Elementary Statistics: Picturing the World (7th E...
Statistics
ISBN:9780134683416
Author:Ron Larson, Betsy Farber
Publisher:PEARSON
The Basic Practice of Statistics
Statistics
ISBN:9781319042578
Author:David S. Moore, William I. Notz, Michael A. Fligner
Publisher:W. H. Freeman
Introduction to the Practice of Statistics
Statistics
ISBN:9781319013387
Author:David S. Moore, George P. McCabe, Bruce A. Craig
Publisher:W. H. Freeman