
MATLAB: An Introduction with Applications
6th Edition
ISBN: 9781119256830
Author: Amos Gilat
Publisher: John Wiley & Sons Inc
expand_more
expand_more
format_list_bulleted
Related questions
Question
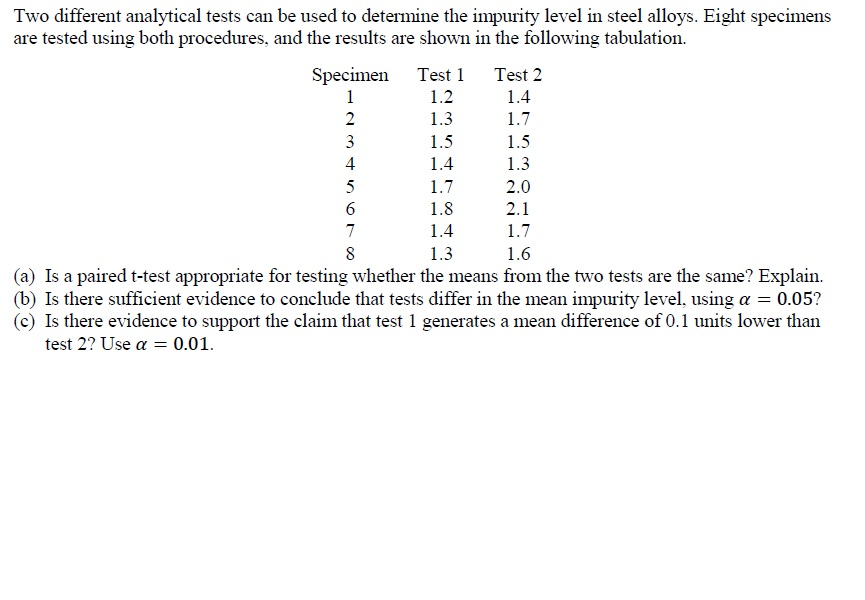

Transcribed Image Text:Two different analytical tests can be used to determine the impurity level in steel alloys. Eight specimens
are tested using both procedures, and the results are shown in the following tabulation.
Specimen
1
2
234
3
4
1.5
1.3
1.7
2.0
1.8
2.1
1.4
1.7
1.3
1.6
(a) Is a paired t-test appropriate for testing whether the means from the two tests are the same? Explain.
(b) Is there sufficient evidence to conclude that tests differ in the mean impurity level, using a = 0.05?
(c) Is there evidence to support the claim that test 1 generates a mean difference of 0.1 units lower than
test 2? Use a = 0.01.
Test 1
1.2
1.3
1.5
1.4
5
6
7
8
Test 2
1.4
1.7
Expert Solution
This question has been solved!
Explore an expertly crafted, step-by-step solution for a thorough understanding of key concepts.

This is a popular solution

Trending nowThis is a popular solution!

Step by stepSolved in 4 steps with 15 images

Knowledge Booster

Similar questions
- Solve the problem. 48) A company manufactures batteries in batches of 29 and there is a 3% rate of defects. Find the mean B) 0.899 number of defects per batch. A) 0.841 C) 0.87 D) 28.13 48)arrow_forwardA researcher wants to know whether athletic women are more flexible than non - athletic women. For this experiment, a woman who exercised vigorously at least four times per week was considered "athletic". Flexibility is measured in inches on a sit & reach box. A researcher tested his claim using the following summary statistics: Athletic women Non-athletic women n = 50 * = 5.0 inches s=1.4 inches Assume that all conditions for testing have been met. t = 1.626; p = 0.057 ; At the 1% significance level, state your decision regarding the null hypothesis and your conclusion about the original claim. n = 30 * = 4.6 inches s= 0.8 inches O A. Fail to reject the null hypothesis; there is not strong enough evidence to suggest that athletic women are more flexible, on average, than non-athletic women. O B. Reject the null hypothesis; there is strong evidence to suggest that non-athletic women are more flexible, on average, than athletic women. OC. Fail to reject the null hypothesis; there is…arrow_forwardResearchers were interested in assessing whether stress levels are different at the beginning of the semester compared to finals week. To test this, stress was measured in 5 students at the start of the semester and then again at the end of the semester during finals week. Participant Stress 1 Stress 2 1 22 22 2 32 34 3 24 25 4 28 30 5 26 29 Then H0: μ2 - μ1 ≠ 0, true or false?arrow_forward
- The average worker at a local brake manufacturer produces 10 brakes per day (other statistical information was not known). An industrial psychologist was hired to increase worker productivity and a new assembly method was designed and tested in a sample of workers. Identify the appropriate test. Select one: a. independent samples t test b. z test c. single sample t test d. paired samples t testarrow_forwardI need help with all parts of this question 19arrow_forwardHave you ever been frustrated because you could not get a container of some sort to release the last bit of its contents? An article reported on an investigation of this issue for various consumer products. Suppose five 6.0 oz tubes of toothpaste of a particular brand are randomly selected and squeezed until no more toothpaste will come out. Then each tube is cut open and the amount remaining is weighed, resulting in the following data: 0.51, 0.63, 0.42, 0.5, 0.35. Does it appear that the true average amount left is less than 10% of the advertised net contents? USE SALT (a) Check the validity of any assumptions necessary for testing the appropriate hypotheses. O The sample was randomly selected and the normal probability plot is not acceptably nonlinear. The sample was selected to represent a range of results and the normal probability plot is not acceptably nonlinear. The sample was selected to represent a range of results and the normal probability plot is not acceptably linear. O…arrow_forward
arrow_back_ios
arrow_forward_ios
Recommended textbooks for you
- MATLAB: An Introduction with ApplicationsStatisticsISBN:9781119256830Author:Amos GilatPublisher:John Wiley & Sons Inc
 Probability and Statistics for Engineering and th...StatisticsISBN:9781305251809Author:Jay L. DevorePublisher:Cengage Learning
 Statistics for The Behavioral Sciences (MindTap C...StatisticsISBN:9781305504912Author:Frederick J Gravetter, Larry B. WallnauPublisher:Cengage Learning
  Elementary Statistics: Picturing the World (7th E...StatisticsISBN:9780134683416Author:Ron Larson, Betsy FarberPublisher:PEARSON
 The Basic Practice of StatisticsStatisticsISBN:9781319042578Author:David S. Moore, William I. Notz, Michael A. FlignerPublisher:W. H. Freeman
 Introduction to the Practice of StatisticsStatisticsISBN:9781319013387Author:David S. Moore, George P. McCabe, Bruce A. CraigPublisher:W. H. Freeman
MATLAB: An Introduction with Applications
Statistics
ISBN:9781119256830
Author:Amos Gilat
Publisher:John Wiley & Sons Inc
Probability and Statistics for Engineering and th...
Statistics
ISBN:9781305251809
Author:Jay L. Devore
Publisher:Cengage Learning
Statistics for The Behavioral Sciences (MindTap C...
Statistics
ISBN:9781305504912
Author:Frederick J Gravetter, Larry B. Wallnau
Publisher:Cengage Learning
Elementary Statistics: Picturing the World (7th E...
Statistics
ISBN:9780134683416
Author:Ron Larson, Betsy Farber
Publisher:PEARSON
The Basic Practice of Statistics
Statistics
ISBN:9781319042578
Author:David S. Moore, William I. Notz, Michael A. Fligner
Publisher:W. H. Freeman
Introduction to the Practice of Statistics
Statistics
ISBN:9781319013387
Author:David S. Moore, George P. McCabe, Bruce A. Craig
Publisher:W. H. Freeman