
Advanced Engineering Mathematics
10th Edition
ISBN: 9780470458365
Author: Erwin Kreyszig
Publisher: Wiley, John & Sons, Incorporated
expand_more
expand_more
format_list_bulleted
Related questions
Question

Transcribed Image Text:### Graph Analysis
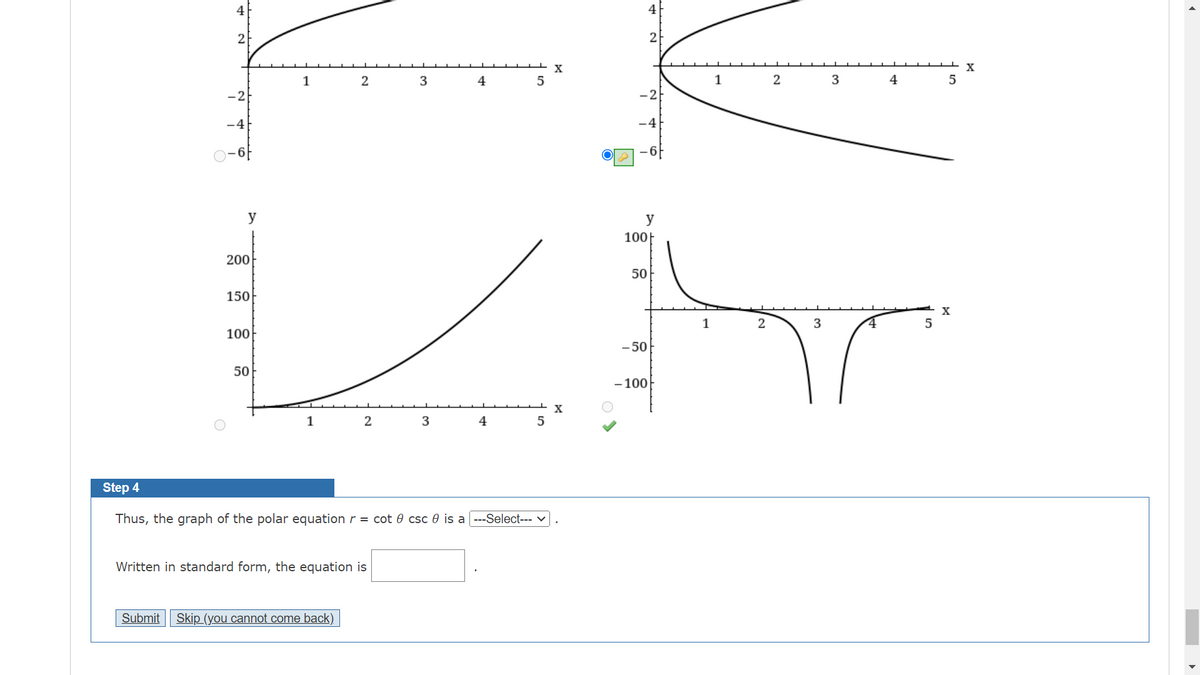
The image displays four graphs, each depicting a different function or equation on a Cartesian coordinate system. Below is a detailed explanation of each graph:
1. **Top Left Graph:**
- **Axes:**
- Horizontal axis labeled as `x`, ranging from 0 to 5.
- Vertical axis labeled as `y`, ranging approximately from -6 to 4.
- **Curve Description:**
- The curve starts below the x-axis and increases steadily. It appears to be a type of exponential or non-linear growth.
2. **Top Right Graph:**
- **Axes:**
- Horizontal axis labeled as `x`, ranging from 0 to 5.
- Vertical axis labeled as `y`, ranging approximately from -6 to 4.
- **Curve Description:**
- This graph displays a curve with a similar initial rise like the first graph but appears to start slightly lower. It may be a variant of the function in the first graph.
3. **Bottom Left Graph:**
- **Axes:**
- Horizontal axis labeled as `x`, ranging from 0 to 5.
- Vertical axis labeled as `y`, ranging from 0 to 200.
- **Curve Description:**
- The curve demonstrates typical exponential growth, starting near the origin and rising rapidly as `x` increases.
4. **Bottom Right Graph:**
- **Axes:**
- Horizontal axis labeled as `x`, ranging from 0 to 5.
- Vertical axis labeled as `y`, approximately ranging from -100 to 100.
- **Curve Description:**
- This graph features a curve with two vertical asymptotes around `x = 2.5` and `x = 4`. The curve approaches infinity both positively and negatively indicative of a rational function with undefined points.
### Instructional Section
**Step 4:**
- **Instructions:**
- Analyze the graph of the polar equation \( r = \cot \theta \csc \theta \).
- Identify the type of graph it forms by selecting an option from the dropdown menu.
- Write the equation in standard form in the provided text box.
- **Submission:**
- Click "Submit" after completing the form.
- Option to "Skip" the step, with a note that you cannot return to it later.
![**Tutorial Exercise**
Convert the polar equation to rectangular form and sketch its graph.
\[ r = 9 \cot(\theta) \csc(\theta) \]
**Step 1**
The polar coordinates \( (r, \theta) \) of a point are related to the rectangular coordinates \( (x, y) \) of the point as follows:
\[ x = r \cos(\theta) \]
\[ y = r \sin(\theta) \]
**Step 2**
The given polar equation can be rewritten as follows:
\[ r = 9 \cot \theta \, \csc \theta \]
\[ r = 9 \cot \theta \cdot \frac{1}{\sin \theta} \]
\[ \frac{r \, \sin(\theta)}{\sin \theta} = 9 \, \cot \theta \]
Converting to rectangular coordinates using \( x = r \cos \theta \) and \( y = r \sin \theta \) gives:
\[ y = \frac{9x}{y} \]
\[ 9x = y^2 \]
**Step 3**
Sketch the graph of \( y^2 = 9x \).
The graph represents a parabola that opens to the right with vertex at the origin.](https://content.bartleby.com/qna-images/question/29b5f486-adb3-4cc3-b768-2d8a64fa9dd5/a9dc0aa1-4c1e-43c3-b51b-47f635c3c725/hpsqoja_processed.png)
Transcribed Image Text:**Tutorial Exercise**
Convert the polar equation to rectangular form and sketch its graph.
\[ r = 9 \cot(\theta) \csc(\theta) \]
**Step 1**
The polar coordinates \( (r, \theta) \) of a point are related to the rectangular coordinates \( (x, y) \) of the point as follows:
\[ x = r \cos(\theta) \]
\[ y = r \sin(\theta) \]
**Step 2**
The given polar equation can be rewritten as follows:
\[ r = 9 \cot \theta \, \csc \theta \]
\[ r = 9 \cot \theta \cdot \frac{1}{\sin \theta} \]
\[ \frac{r \, \sin(\theta)}{\sin \theta} = 9 \, \cot \theta \]
Converting to rectangular coordinates using \( x = r \cos \theta \) and \( y = r \sin \theta \) gives:
\[ y = \frac{9x}{y} \]
\[ 9x = y^2 \]
**Step 3**
Sketch the graph of \( y^2 = 9x \).
The graph represents a parabola that opens to the right with vertex at the origin.
Expert Solution
This question has been solved!
Explore an expertly crafted, step-by-step solution for a thorough understanding of key concepts.

Step by stepSolved in 3 steps with 3 images

Knowledge Booster

Similar questions
- Rewrite the Cartesian equation x = 5 as a polar equation. r(0) = Enter theta for 0 if needed. Question Help: Message instructor > Next Questionarrow_forwardConvert the polar equation to a rectangular equation. Then use a rectangular coordinate system to graph the rectangular equation. r= 12 cos 0 Choose the correct rectangular equation for r= 12 cos 0 below. O A. + (y+6): O B. (x-6)?+y? = 36 O D. (x+6)? +y = 3 = 36 O C. + (y-6)? = = 36 Choose the correct graph of the rectangular equation below. O B. Oc. OD. O A. Ay 7-arrow_forward
Recommended textbooks for you
- Advanced Engineering MathematicsAdvanced MathISBN:9780470458365Author:Erwin KreyszigPublisher:Wiley, John & Sons, Incorporated
 Numerical Methods for EngineersAdvanced MathISBN:9780073397924Author:Steven C. Chapra Dr., Raymond P. CanalePublisher:McGraw-Hill Education
 Introductory Mathematics for Engineering Applicat...Advanced MathISBN:9781118141809Author:Nathan KlingbeilPublisher:WILEY
  Mathematics For Machine TechnologyAdvanced MathISBN:9781337798310Author:Peterson, John.Publisher:Cengage Learning,

Advanced Engineering Mathematics
Advanced Math
ISBN:9780470458365
Author:Erwin Kreyszig
Publisher:Wiley, John & Sons, Incorporated
Numerical Methods for Engineers
Advanced Math
ISBN:9780073397924
Author:Steven C. Chapra Dr., Raymond P. Canale
Publisher:McGraw-Hill Education
Introductory Mathematics for Engineering Applicat...
Advanced Math
ISBN:9781118141809
Author:Nathan Klingbeil
Publisher:WILEY
Mathematics For Machine Technology
Advanced Math
ISBN:9781337798310
Author:Peterson, John.
Publisher:Cengage Learning,