
MATLAB: An Introduction with Applications
6th Edition
ISBN: 9781119256830
Author: Amos Gilat
Publisher: John Wiley & Sons Inc
expand_more
expand_more
format_list_bulleted
Related questions
Concept explainers
Topic Video
Question
i want to make sure
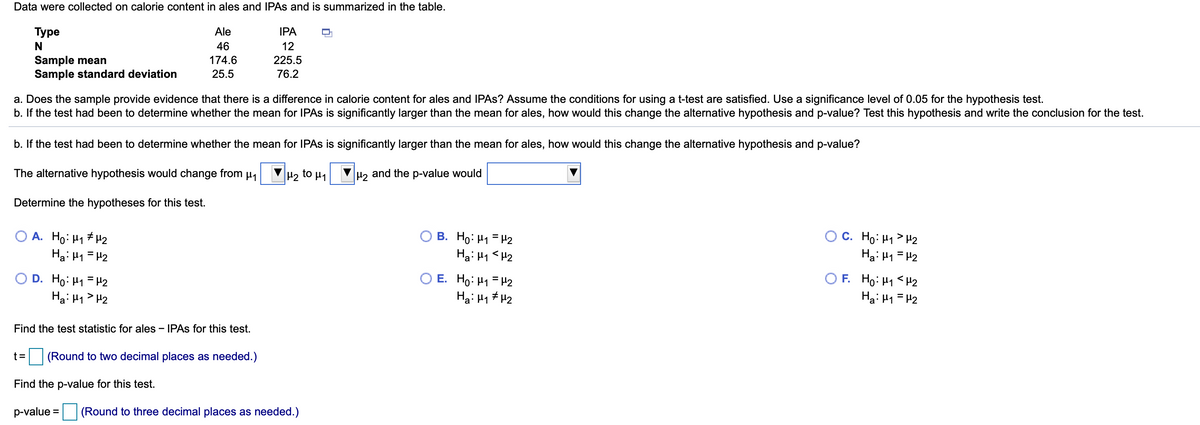

Transcribed Image Text:Data were collected on calorie content in ales and IPAS and is summarized in the table.
Туре
Ale
IPA
N
46
12
Sample mean
Sample standard deviation
174.6
225.5
25.5
76.2
a. Does the sample provide evidence that there is a difference in calorie content for ales and IPAS? Assume the conditions for using a t-test are satisfied. Use a significance level of 0.05 for the hypothesis test.
b. If the test had been to determine whether the mean for IPAS is significantly larger than the mean for ales, how would this change the alternative hypothesis and p-value? Test this hypothesis and write the conclusion for the test.
b. If the test had been to determine whether the mean for IPAS is significantly larger than the mean for ales, how would this change the alternative hypothesis and p-value?
The alternative hypothesis would change from µ,
H2 to µ1
H, and the p-value would
Determine the hypotheses for this test.
O A. Ho: H1 # H2
Ha: 41 = H2
В. Но Н -2
Hai H1 <H2
C. Ho: H1 > H2
Ha: H1 =H2
E. Ho: H1 = H2
Ha: H1 # H2
Ho: H1 <H2
Ha: H1 = H2
D. Ho: H1 = H2
F.
Ha: H1> H2
Find the test statistic for ales - IPAS for this test.
t=
(Round to two decimal places as needed.)
Find the p-value for this test.
p-value =
(Round to three decimal places as needed.)

Transcribed Image Text:Data were collected on calorie content in ales and IPAS and is summarized in the table.
Туре
Ale
IPA
46
12
Sample mean
Sample standard deviation
174.6
225.5
25.5
76.2
a. Does the sample provide evidence that there is a difference in calorie content for ales and IPAS? Assume the conditions for using a t-test are satisfied. Use a significance level of 0.05 for the hypothesis test.
b. If the test had been to determine whether the mean for IPAS is significantly larger than the mean for ales, how would this change the alternative hypothesis and p-value? Test this hypothesis and write the conclusion for the test.
a. Determine the hypotheses for this test. Let µ, be the population mean calorie count of ales and let µ, be the population mean calorie count of IPAS. Choose the correct answer below.
A. Ho: H1 = H2
Hai H1> H2
В. Но М Н2
Hai 41 = H2
C. Ho: H1 <H2
Ha: H1 = H2
O D. Ho: H1 # H2
Hai H1 = H2
F. Ho: H1 = H2
Ha: H1 # H2
E. Ho: H1 = H2
Ha: H1 <H2
Find the test statistic for ales - IPAS for this test.
t=
- 0.09 (Round to two decimal places as needed.)
Find the p-value for this test.
p-value = 0.536 (Round to three decimal places as needed.)
What is the conclusion for this test?
Expert Solution
This question has been solved!
Explore an expertly crafted, step-by-step solution for a thorough understanding of key concepts.

This is a popular solution

Trending nowThis is a popular solution!

Step by stepSolved in 2 steps with 1 images

Knowledge Booster


Learn more about
Need a deep-dive on the concept behind this application? Look no further. Learn more about this topic, statistics and related others by exploring similar questions and additional content below.Similar questions
Recommended textbooks for you
- MATLAB: An Introduction with ApplicationsStatisticsISBN:9781119256830Author:Amos GilatPublisher:John Wiley & Sons Inc
 Probability and Statistics for Engineering and th...StatisticsISBN:9781305251809Author:Jay L. DevorePublisher:Cengage Learning
 Statistics for The Behavioral Sciences (MindTap C...StatisticsISBN:9781305504912Author:Frederick J Gravetter, Larry B. WallnauPublisher:Cengage Learning
  Elementary Statistics: Picturing the World (7th E...StatisticsISBN:9780134683416Author:Ron Larson, Betsy FarberPublisher:PEARSON
 The Basic Practice of StatisticsStatisticsISBN:9781319042578Author:David S. Moore, William I. Notz, Michael A. FlignerPublisher:W. H. Freeman
 Introduction to the Practice of StatisticsStatisticsISBN:9781319013387Author:David S. Moore, George P. McCabe, Bruce A. CraigPublisher:W. H. Freeman
MATLAB: An Introduction with Applications
Statistics
ISBN:9781119256830
Author:Amos Gilat
Publisher:John Wiley & Sons Inc
Probability and Statistics for Engineering and th...
Statistics
ISBN:9781305251809
Author:Jay L. Devore
Publisher:Cengage Learning
Statistics for The Behavioral Sciences (MindTap C...
Statistics
ISBN:9781305504912
Author:Frederick J Gravetter, Larry B. Wallnau
Publisher:Cengage Learning
Elementary Statistics: Picturing the World (7th E...
Statistics
ISBN:9780134683416
Author:Ron Larson, Betsy Farber
Publisher:PEARSON
The Basic Practice of Statistics
Statistics
ISBN:9781319042578
Author:David S. Moore, William I. Notz, Michael A. Fligner
Publisher:W. H. Freeman
Introduction to the Practice of Statistics
Statistics
ISBN:9781319013387
Author:David S. Moore, George P. McCabe, Bruce A. Craig
Publisher:W. H. Freeman