
MATLAB: An Introduction with Applications
6th Edition
ISBN: 9781119256830
Author: Amos Gilat
Publisher: John Wiley & Sons Inc
expand_more
expand_more
format_list_bulleted
Related questions
Concept explainers
Question
thumb_up100%
Can someone help me explain question two and three?
I don't know how to conclude from the table given.
This is the information they have given me
<Name hotel> has a very good complaint handling the procedure.
Please answer on a scale from 1 (totally disagree) to 10 (totally agree)
Comparison Hotel Paramaribo with Hotel Rio de Janeiro.
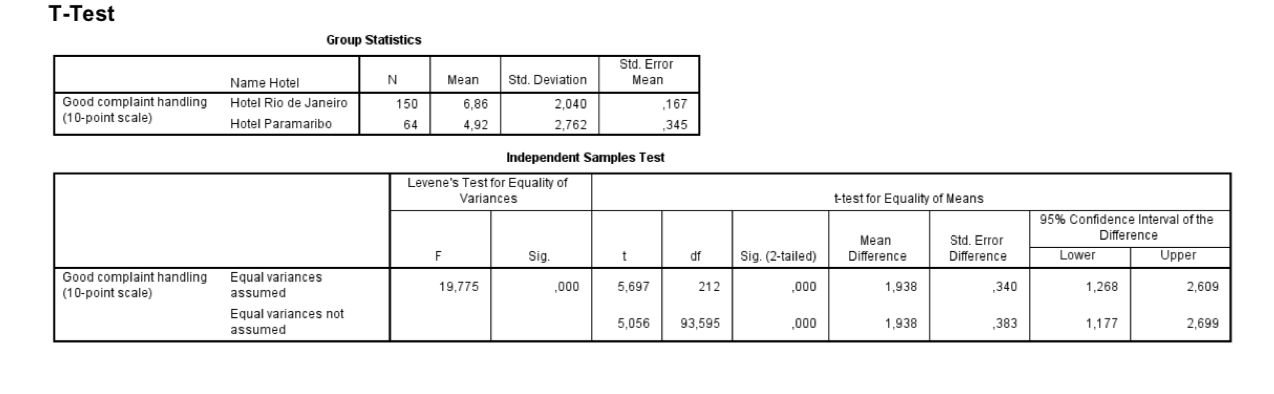

Transcribed Image Text:T-Test
Group Statistics
Std. Error
Std. Deviation
N
Mean
Mean
Name Hotel
Good complaint handling
(10-point scale)
Hotel Rio de Janeiro
150
6,86
2,040
167
Hotel Paramaribo
64
4,92
2,762
345
Independent Samples Test
Levene's Test for Equality of
Variances
t-test for Equality of Means
95% Confidence Interval of the
Difference
Mean
Std. Error
Lower
Upper
F
Sig.
t
df
Sig. (2-tailed)
Difference
Difference
Good complaint handling
(10-point scale)
Equal variances
19,775
000
5,697
212
340
000
1,938
1,268
2,609
assumed
Equal variances not
5,056
93,595
000
1,938
383
1,177
2,699
assumed
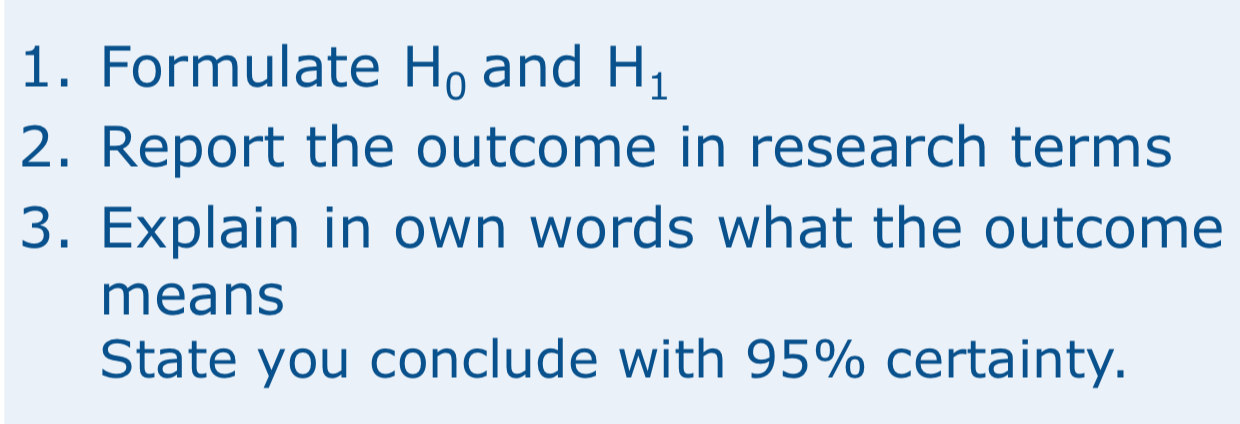
Transcribed Image Text:1. Formulate Ho and H
1
2. Report the outcome in research terms
3. Explain in own words what the outcome
means
State you conclude with 95% certainty.
Expert Solution
This question has been solved!
Explore an expertly crafted, step-by-step solution for a thorough understanding of key concepts.

This is a popular solution

Trending nowThis is a popular solution!

Step by stepSolved in 2 steps with 1 images

Knowledge Booster


Learn more about
Need a deep-dive on the concept behind this application? Look no further. Learn more about this topic, statistics and related others by exploring similar questions and additional content below.Similar questions
- Describe about the interpret decision in terms of the original research problem.arrow_forwardplease do the following parts, this is one question! hypotheses, assumptions, and please check the assumptions (listed as a problem in the image)arrow_forwardDescribe about the selecting and interpreting level of significance.arrow_forward
- What are some of the instruments that can be used to conduct a research project? How does one select the correct one?arrow_forwardPic 1 has the question and pic 2 has the optionsarrow_forwardFor the following questions, THERE IS NO NEED FOR EXPLANATION. PLEASE PROVIDE JUST THE ANSWER THANK YOU. Please DO NOT waste time on writing things to explain. Please answer in 30 mintues or else I will write a bad review. If you follow my rules and answer in less than 30 mintues then I will write a very long and wonderful review about you. ANSWER the questions correlty and please answer all the questions with what it regards in saying exactly.arrow_forward
- Please answer first pic is for reference. F and P Value ty!arrow_forwardIn complete sentences, explain what a hypothesis test tells us and what an ettect size tells us. Describe in general terms. Be sure that your response CONTRASTS the two, i.e., explains how they are different but are both part of understanding relationships between variables. You're welcome to use examples to explain your points. Imagine you are explaining this to a friend.arrow_forward
arrow_back_ios
arrow_forward_ios
Recommended textbooks for you
- MATLAB: An Introduction with ApplicationsStatisticsISBN:9781119256830Author:Amos GilatPublisher:John Wiley & Sons Inc
 Probability and Statistics for Engineering and th...StatisticsISBN:9781305251809Author:Jay L. DevorePublisher:Cengage Learning
 Statistics for The Behavioral Sciences (MindTap C...StatisticsISBN:9781305504912Author:Frederick J Gravetter, Larry B. WallnauPublisher:Cengage Learning
  Elementary Statistics: Picturing the World (7th E...StatisticsISBN:9780134683416Author:Ron Larson, Betsy FarberPublisher:PEARSON
 The Basic Practice of StatisticsStatisticsISBN:9781319042578Author:David S. Moore, William I. Notz, Michael A. FlignerPublisher:W. H. Freeman
 Introduction to the Practice of StatisticsStatisticsISBN:9781319013387Author:David S. Moore, George P. McCabe, Bruce A. CraigPublisher:W. H. Freeman
MATLAB: An Introduction with Applications
Statistics
ISBN:9781119256830
Author:Amos Gilat
Publisher:John Wiley & Sons Inc
Probability and Statistics for Engineering and th...
Statistics
ISBN:9781305251809
Author:Jay L. Devore
Publisher:Cengage Learning
Statistics for The Behavioral Sciences (MindTap C...
Statistics
ISBN:9781305504912
Author:Frederick J Gravetter, Larry B. Wallnau
Publisher:Cengage Learning
Elementary Statistics: Picturing the World (7th E...
Statistics
ISBN:9780134683416
Author:Ron Larson, Betsy Farber
Publisher:PEARSON
The Basic Practice of Statistics
Statistics
ISBN:9781319042578
Author:David S. Moore, William I. Notz, Michael A. Fligner
Publisher:W. H. Freeman
Introduction to the Practice of Statistics
Statistics
ISBN:9781319013387
Author:David S. Moore, George P. McCabe, Bruce A. Craig
Publisher:W. H. Freeman