ENGR.ECONOMIC ANALYSIS
14th Edition
ISBN: 9780190931919
Author: NEWNAN
Publisher: Oxford University Press
expand_more
expand_more
format_list_bulleted
Question
![**Economics Question**
*True or False:* If spending exceeds output, real GDP will decline as firms cut back on production.
[Dropdown Menu]](https://content.bartleby.com/qna-images/question/926090c8-f7f7-4b72-833b-71d74add87de/790404fb-a2e3-42ad-af27-255e4d3c93a6/4jvrebf_thumbnail.png)
Transcribed Image Text:**Economics Question**
*True or False:* If spending exceeds output, real GDP will decline as firms cut back on production.
[Dropdown Menu]

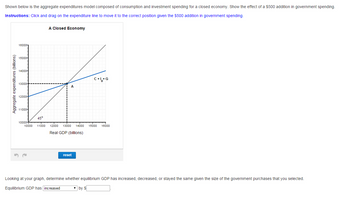
Transcribed Image Text:### Aggregate Expenditures Model: Closed Economy
**Overview:**
The diagram presented is an aggregate expenditures model, illustrating the relationship between consumption, investment spending, government spending, and real GDP within a closed economy. This model is designed to showcase the effect of a $500 increase in government spending.
**Instructions:**
Click and drag on the expenditure line to adjust it to the correct position reflective of the $500 addition in government spending.
**Graph Explanation:**
#### Diagram Details:
- **Title:** A Closed Economy
- **Y-Axis:** Aggregate Expenditures (billions)
- Scale: Ranges from 10,000 to 18,000 billion dollars.
- **X-Axis:** Real GDP (billions)
- Scale: Ranges from 10,000 to 16,000 billion dollars.
- Labeled points for Real GDP include 13,080 and 13,500.
- **Lines:**
- **45° Line:** The gray line represents the point where aggregate expenditures equal real GDP.
- **Initial Expenditure Line (C + I_g + G):** The blue line represents the initial expenditure level.
- **Intersection Point:**
- The initial equilibrium point (A) is located where the blue line intersects the 45° line near a Real GDP of 13,000 billion dollars and aggregate expenditures of about 13,200 billion dollars.
**Interactive Element:**
- Click and drag the blue expenditure line to reflect the $500 increase in government spending.
**Instruction Follow-up:**
Looking at your adjusted graph, determine whether the equilibrium GDP has increased, decreased, or stayed the same given the size of the government purchases that you selected.
Equilibrium GDP has ________ by $________.
---
By following these instructions and understanding the graph's components, users can visually grasp the impact of government spending on aggregate expenditures and the resulting changes in equilibrium GDP within a closed economy.
Expert Solution
This question has been solved!
Explore an expertly crafted, step-by-step solution for a thorough understanding of key concepts.
Step by stepSolved in 3 steps

Knowledge Booster
Learn more about
Need a deep-dive on the concept behind this application? Look no further. Learn more about this topic, economics and related others by exploring similar questions and additional content below.Similar questions
- How much more output does the $20 trillion U.S economy produce when GDP increases by 1.0 percent?arrow_forward"In the classical model, the equilibrium level of real Gross Domestic Product (GDP) is completely supply-determined." Do you agree or disagree? Why?arrow_forwardIn the classical model, what are the effects of an increase in government spending?arrow_forward
- Write out and explain the GDP and Aggregate Expenditure identity equations.arrow_forwardif inventories are increasing, what part of the business cycle could we be entering? Group of answer choices Depression Peak Recession Expansionarrow_forwardIf when real GDP equals $800 billion, imports equal $100 billion, and when real GDP equals $900 billion, imports equal $110 billion, then what is the marginal propensity to import? Enter the answer in decimal form, rounded to one decimal place. marginal propensity to import:arrow_forward
- 1. Key facts about economic fluctuations The graph included below approximates United States business cycles between quarter one of 1947 and quarter three of 1951. The shaded region denotes periods of six or more consecutive months of declining real gross domestic product (real GDP). REAL GDP (Billions of dollars) 2170 2070 1970 1870 1770 1947 1948 1949 YEAR 1950 1951 ?arrow_forwardWhat would cause domestic investment to go down? a decrease in interest rates none of the answers given is correct an increase in interest rates.arrow_forward
arrow_back_ios
arrow_forward_ios
Recommended textbooks for you

 Principles of Economics (12th Edition)EconomicsISBN:9780134078779Author:Karl E. Case, Ray C. Fair, Sharon E. OsterPublisher:PEARSON
 Engineering Economy (17th Edition)EconomicsISBN:9780134870069Author:William G. Sullivan, Elin M. Wicks, C. Patrick KoellingPublisher:PEARSON
 Principles of Economics (MindTap Course List)EconomicsISBN:9781305585126Author:N. Gregory MankiwPublisher:Cengage Learning
 Managerial Economics: A Problem Solving ApproachEconomicsISBN:9781337106665Author:Luke M. Froeb, Brian T. McCann, Michael R. Ward, Mike ShorPublisher:Cengage Learning
 Managerial Economics & Business Strategy (Mcgraw-...EconomicsISBN:9781259290619Author:Michael Baye, Jeff PrincePublisher:McGraw-Hill Education


Principles of Economics (12th Edition)
Economics
ISBN:9780134078779
Author:Karl E. Case, Ray C. Fair, Sharon E. Oster
Publisher:PEARSON

Engineering Economy (17th Edition)
Economics
ISBN:9780134870069
Author:William G. Sullivan, Elin M. Wicks, C. Patrick Koelling
Publisher:PEARSON

Principles of Economics (MindTap Course List)
Economics
ISBN:9781305585126
Author:N. Gregory Mankiw
Publisher:Cengage Learning

Managerial Economics: A Problem Solving Approach
Economics
ISBN:9781337106665
Author:Luke M. Froeb, Brian T. McCann, Michael R. Ward, Mike Shor
Publisher:Cengage Learning

Managerial Economics & Business Strategy (Mcgraw-...
Economics
ISBN:9781259290619
Author:Michael Baye, Jeff Prince
Publisher:McGraw-Hill Education