
Trigonometry (11th Edition)
11th Edition
ISBN: 9780134217437
Author: Margaret L. Lial, John Hornsby, David I. Schneider, Callie Daniels
Publisher: PEARSON
expand_more
expand_more
format_list_bulleted
Related questions
Question

Transcribed Image Text:**Text:**
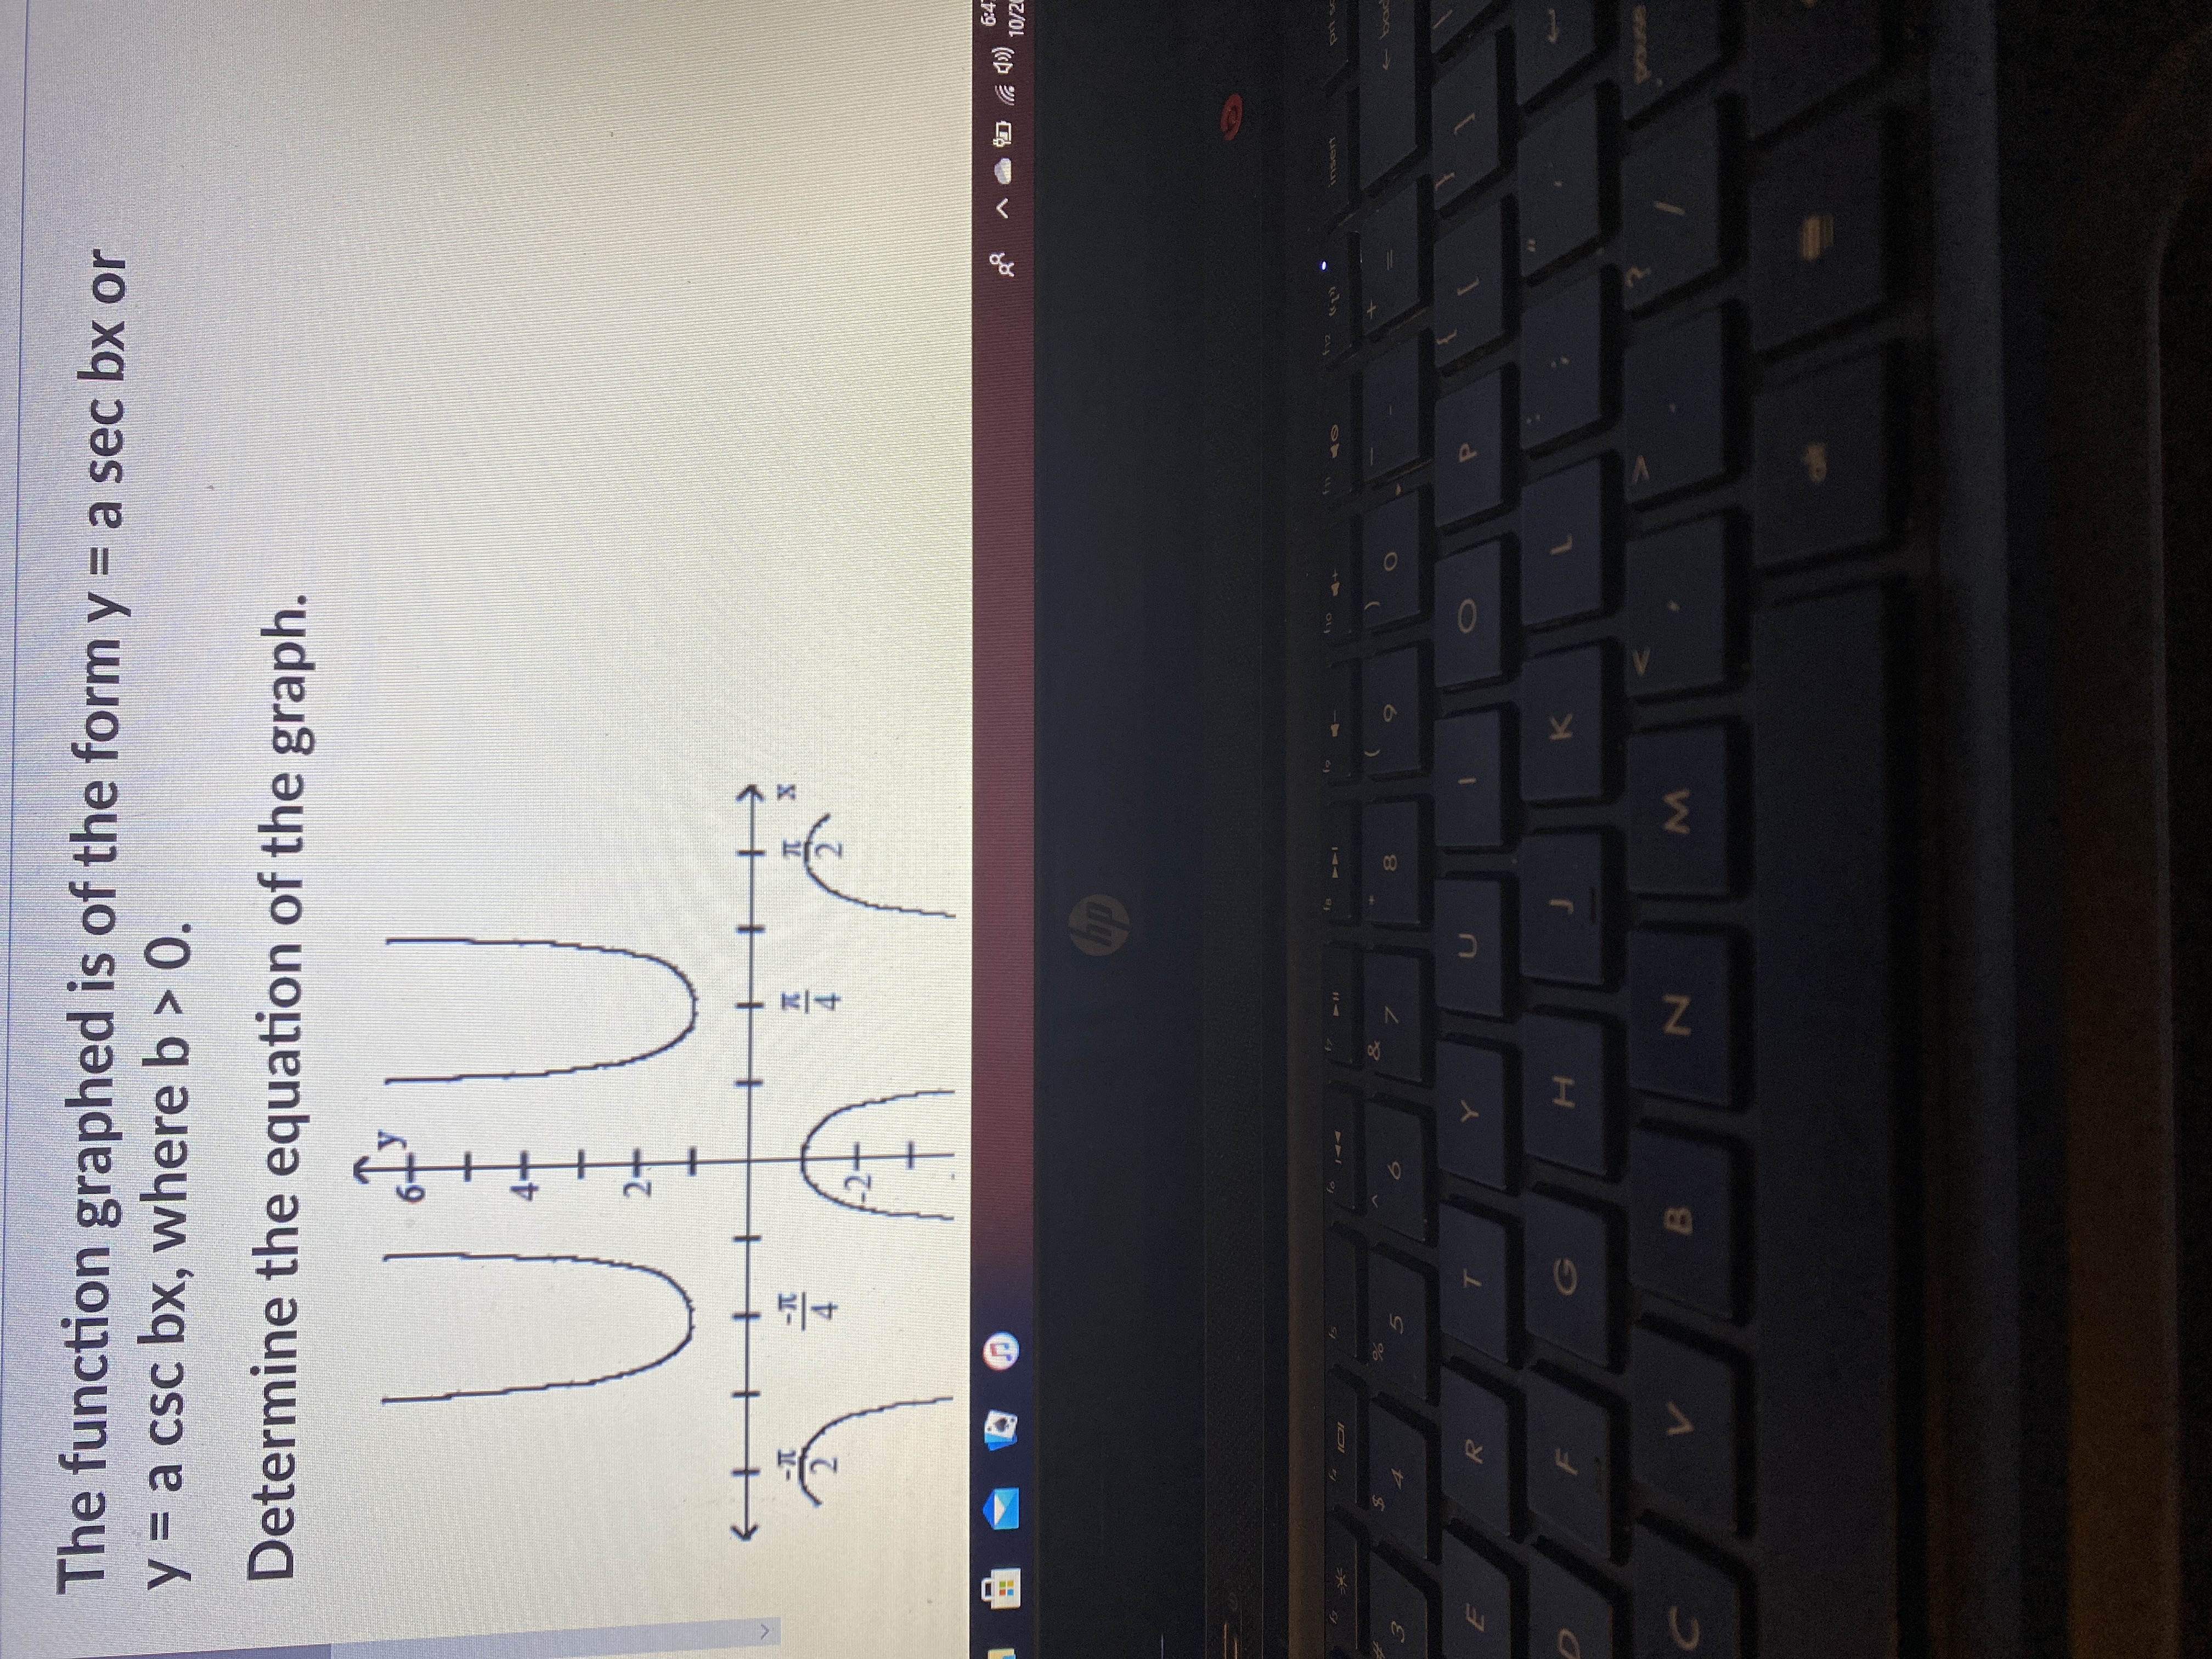
The function graphed is of the form \( y = a \sec(bx) \) or \( y = a \csc(bx) \), where \( b > 0 \).
Determine the equation of the graph.
**Graph Explanation:**
The graph shows two segments of an upward-opening curve and one downward-opening curve, consistent with the behavior of a secant function. These curves intersect the \( y \)-axis and have vertical asymptotes where the function is undefined.
- The \( x \)-axis is labeled with key points at \(-\frac{\pi}{2}\), \(-\frac{\pi}{4}\), \(0\), \(\frac{\pi}{4}\), and \(\frac{\pi}{2}\).
- The \( y \)-axis is labeled with integers from \(-6\) to \(6\), indicating the range on the graph.
- Vertical asymptotes are visible at \( x = -\frac{\pi}{2} \), \( x = 0 \), and \( x = \frac{\pi}{2} \).
- The curves pass through \( (0, 1) \) and appear symmetric about the \( y \)-axis, which suggests the usage of a secant function.
Given these observations, \( b \) in the functions \( \sec(bx) \) or \( \csc(bx) \) would be calculated to match the period \(-\frac{\pi}{2}\) to \(\frac{\pi}{2}\), implying a full period of \(\pi\). Hence, \( b = 2 \), and the equation is likely \( y = \sec(2x) \).
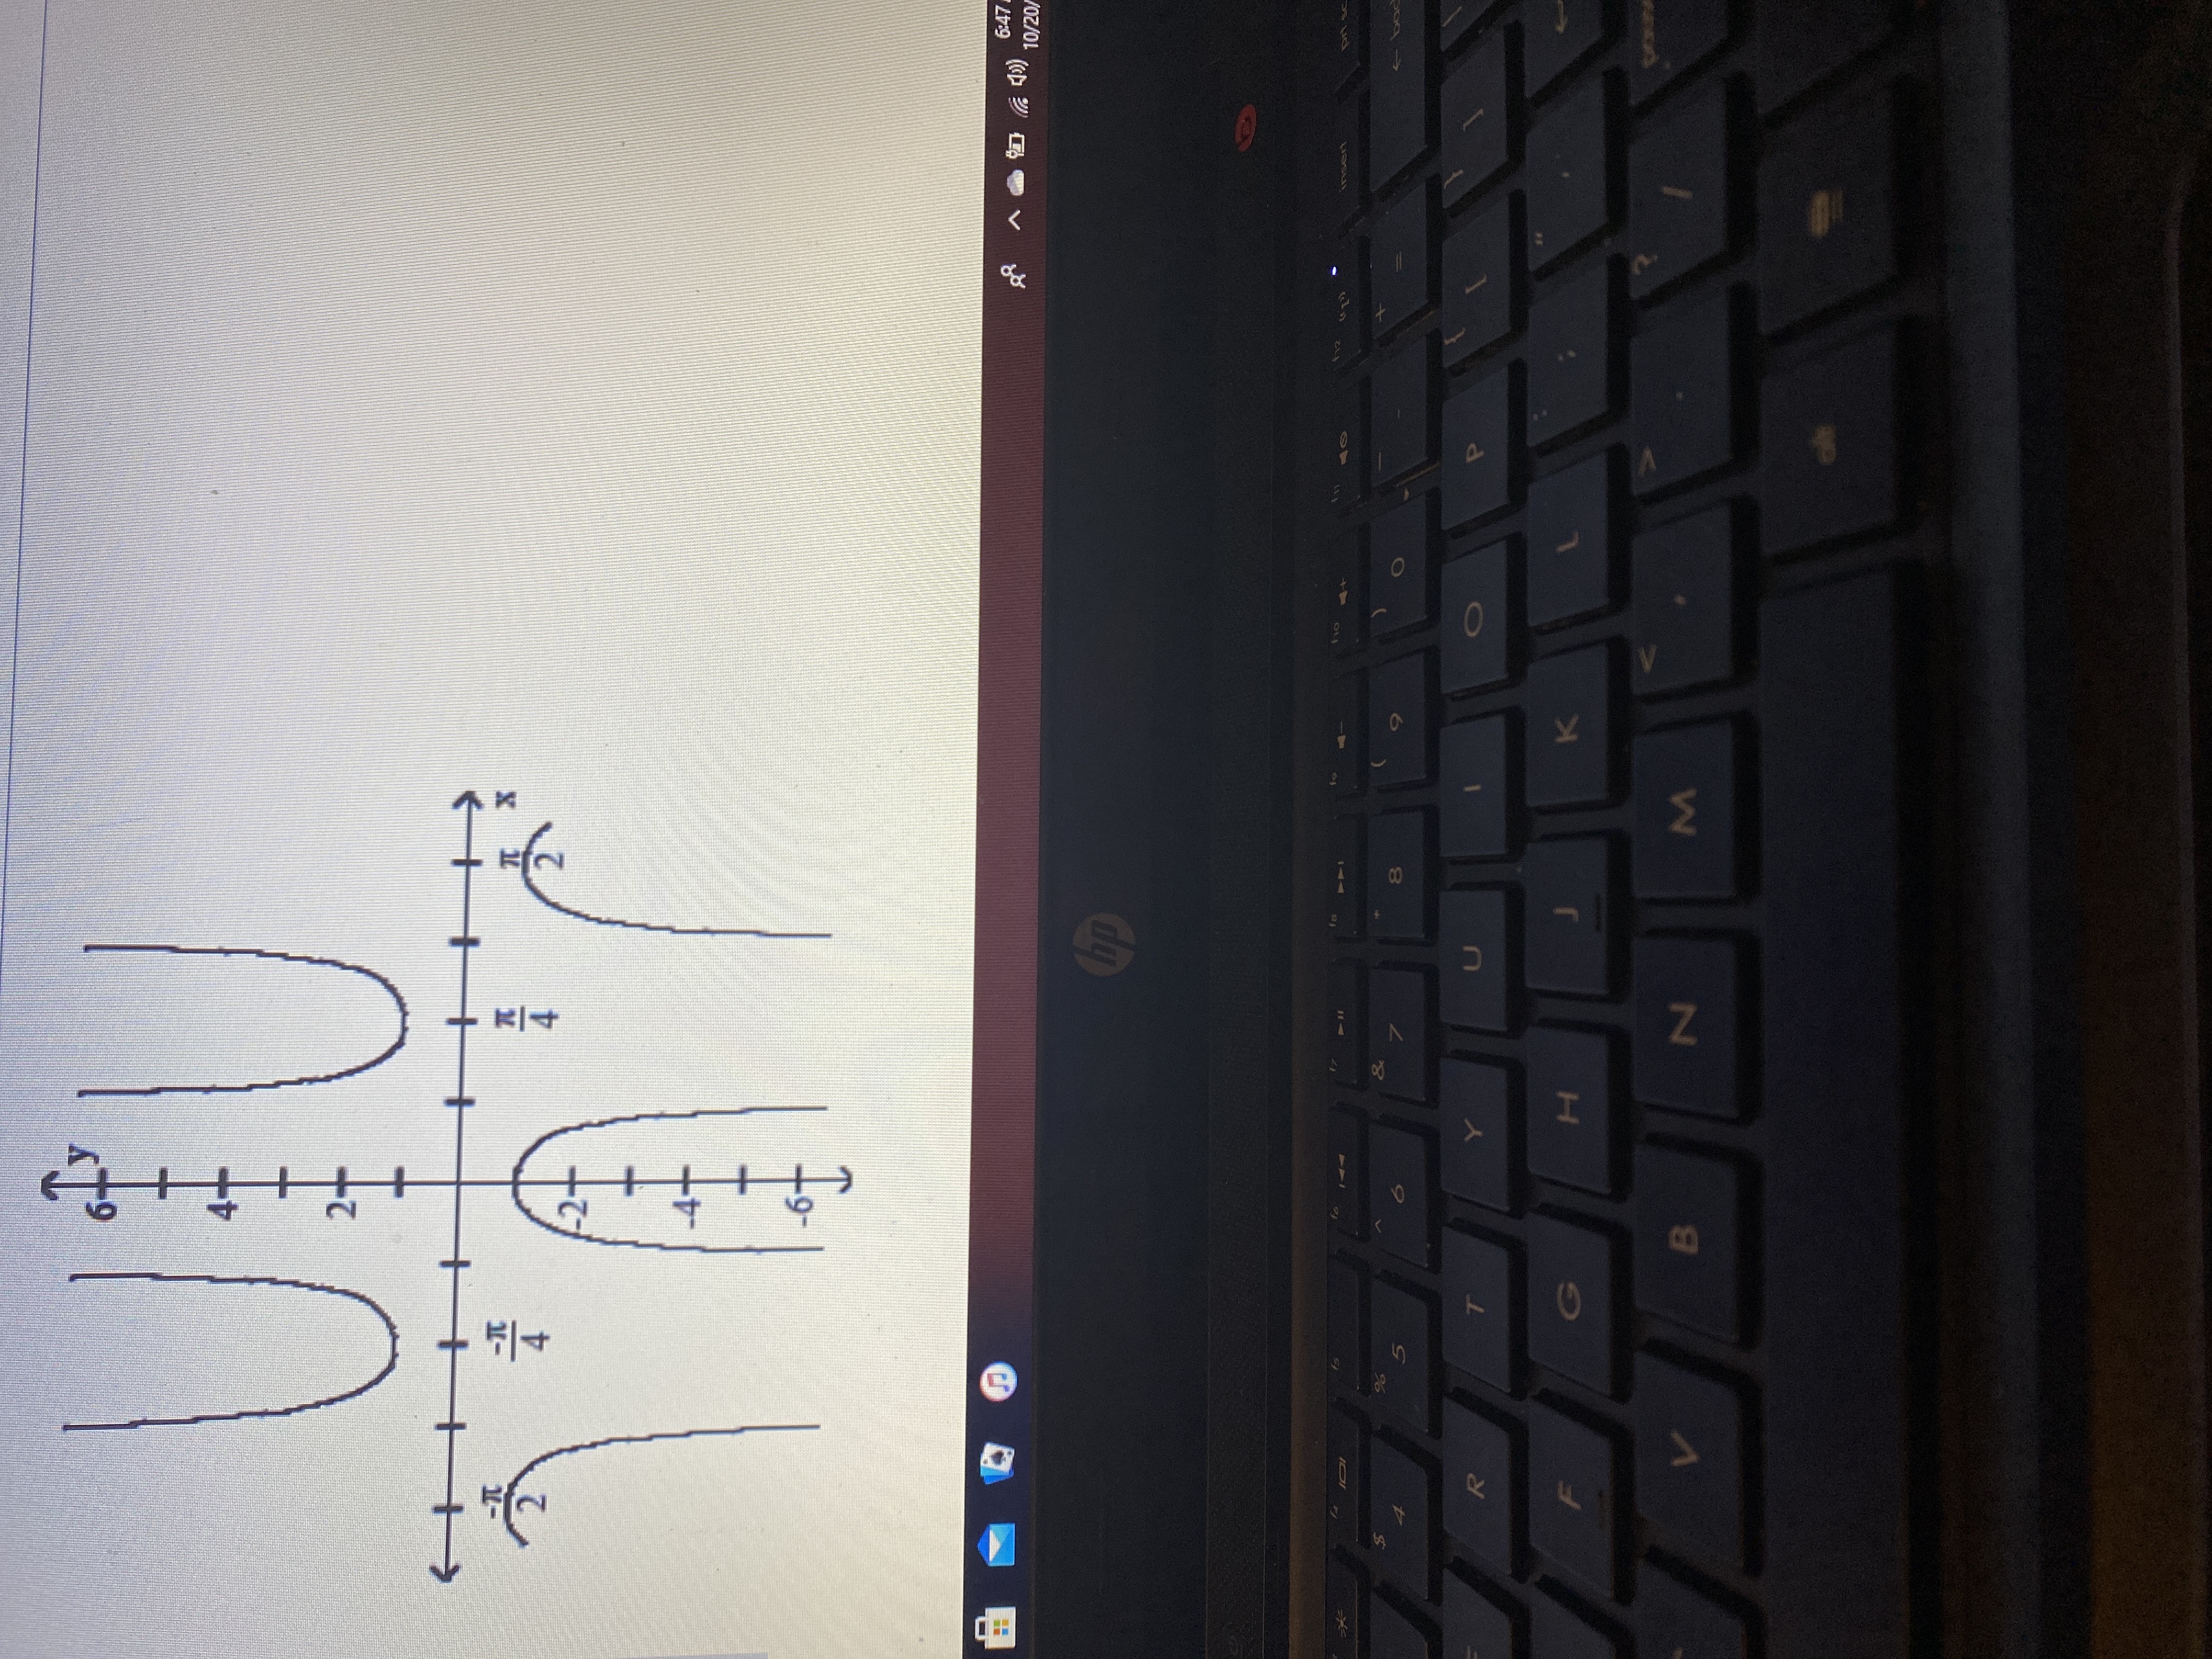
Transcribed Image Text:The image shows a graph with both x and y axes. The graph depicts a periodic function, likely the cosine function.
**Axes Description:**
- The x-axis is labeled "x" with tick marks at \(-\frac{\pi}{2}\), \(-\frac{\pi}{4}\), \(0\), \(\frac{\pi}{4}\), and \(\frac{\pi}{2}\).
- The y-axis is labeled "y" with tick marks at intervals of 2, ranging from -6 to 6.
**Function Description:**
- The function appears to have the shape of an inverted cosine curve. There are two full cycles shown between \(-\frac{\pi}{2}\) and \(\frac{\pi}{2}\).
- The maximum points of the curves appear at the y-values of 6, while the minima hit -6.
This graph is likely used to illustrate the periodic nature and properties of cosine or a similar trigonometric function, such as plotting transformations or examining amplitude and frequency changes.
Expert Solution
This question has been solved!
Explore an expertly crafted, step-by-step solution for a thorough understanding of key concepts.

This is a popular solution

Trending nowThis is a popular solution!

Step by stepSolved in 5 steps with 4 images

Knowledge Booster

Recommended textbooks for you
- Trigonometry (11th Edition)TrigonometryISBN:9780134217437Author:Margaret L. Lial, John Hornsby, David I. Schneider, Callie DanielsPublisher:PEARSON
 Trigonometry (MindTap Course List)TrigonometryISBN:9781305652224Author:Charles P. McKeague, Mark D. TurnerPublisher:Cengage Learning
 Trigonometry (MindTap Course List)TrigonometryISBN:9781337278461Author:Ron LarsonPublisher:Cengage Learning
Trigonometry (11th Edition)
Trigonometry
ISBN:9780134217437
Author:Margaret L. Lial, John Hornsby, David I. Schneider, Callie Daniels
Publisher:PEARSON
Trigonometry (MindTap Course List)
Trigonometry
ISBN:9781305652224
Author:Charles P. McKeague, Mark D. Turner
Publisher:Cengage Learning
Trigonometry (MindTap Course List)
Trigonometry
ISBN:9781337278461
Author:Ron Larson
Publisher:Cengage Learning