|
Treatment |
Sham |
||
|
μ |
μ1 |
μ2 |
|
|
n |
25 |
25 |
|
|
x |
0.55 |
0.43 |
|
|
s |
0.78 |
1.42 |
a. Use a 0.05 significance level to test the claim that those treated with magnets have a greater
What are the null and alternative hypotheses?
A.
H0: μ1=μ2
H1: μ1>μ2
B.
H0: μ1<μ2
H1: μ1≥μ2
C.
H0: μ1≠μ2
H1: μ1<μ2
D.
H0: μ1=μ2
H1: μ1≠ μ2
State the hypotheses.
(a)

That is, there is no evidence to conclude that those treated with magnets have a greater mean reduction in pain than those given a sham treatment.

That is, there is evidence to conclude that those treated with magnets have a greater mean
reduction in pain than those given a sham treatment.
Correct option: Option A
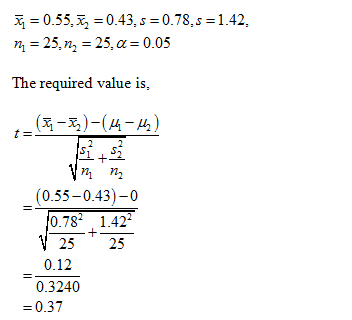
Obtain the value of the test statistic.
The value of the test statistic is obtained below:
From the information, given that

Thus, the value of the test statistic is 0.37.
Step by stepSolved in 3 steps with 5 images

- Please answer all sectionsarrow_forward59arrow_forwardTest the claim that the proportion of people who own dogs is less than 33%. A random sample of 1000 people found that 27.8% owned dogs. Do the sample data provide convincing evidence to support the claim? Test the relevant hypotheses using a 1% level of significance. Give answer to at least 4 decimal places. What is the Test Statistic (Note: using a Z or T table will be incorrect for this course)arrow_forward
- You wish to test the following claim (HaHa) at a significance level of α=0.02 For the context of this problem, μd=μ2−μ1 where the first data set represents a pre-test and the second data set represents a post-test. Ho:μd=0 Ha:μd>0You believe the population of difference scores is normally distributed, but you do not know the standard deviation. You obtain pre-test and post-test samples for n=5 subjects. The average difference (post - pre) is ¯d=47.2 with a standard deviation of the differences of sd=36.4What is the test statistic for this sample? (Report answer accurate to three decimal places.)test statistic = What is the p-value for this sample? (Report answer accurate to four decimal places.)p-value = The p-value is... less than (or equal to) αα greater than αα This test statistic leads to a decision to... reject the null accept the null fail to reject the null As such, the final conclusion is that... There is sufficient evidence to warrant rejection of the…arrow_forwardShould p be assumed normal? (a) n= 175, n=.08 %3D points O No O Yes еВook (b) n= 125, 7= .04 Ask O Yes O No Print References (c) n= 150, =.02 O No O Yes previous Mc Graw Hill Educationarrow_forwardIf you use α = .001, using p-value for X2, is the coefficient of X2 is significantly different from 0. Yes Noarrow_forward
- What does it mean for an estimator to be unbiased? (Hint: you do not need to state the formal definition of unbiasedness)arrow_forwardB. Would the Floor Area be a significant predictor of Assessed Value?arrow_forwardI asked this question yesterday and the answer was incorrect. Please see previous responses below that were incorrect for your reference. Thanks again! β = 0.4091 α = 3.1455 The lineal regression equation is y = 3.1455 +0.4091 x (second screenshot is the second step to the question that I received yesterday as well)arrow_forward
- If you use α = .001, using p-value for X1, is the coefficient of X1 is significantly different from 0. Yes Noarrow_forwardAre the heights of individuals affected by the heights of their parents. Regression Statistics Multiple R R Square Adjusted R Squar 0.631071992 0.398251859 0.365724932 Standard Error 2.914527039 Observations 40 ANOVA df MS F Significance F Regression Residual 2 208.0084392 104.0042 12.24376 8.30181E-05 37 314.2953108 8.494468 Total 39 522.30375 Coefficients Standard Error t Stat P-value Intercept Mother's Height Father's Height 9.804326378 12.39987353 0.79068 0.43417 0.657952815 0.147476295 4.461414 7.34E-05 0.200358437 0.138223638 1.449524 0.155615 1. Write the regression equation that represents the above equation. 2. Is this a good predictor equation? Why or why not (use appropriate statistics/hypothesis test to prove your point)? 3. Use the equation to predict the height of someone whose mother is 52 inches tall and whose father is 70 inches tall.arrow_forward
 MATLAB: An Introduction with ApplicationsStatisticsISBN:9781119256830Author:Amos GilatPublisher:John Wiley & Sons Inc
 Probability and Statistics for Engineering and th...StatisticsISBN:9781305251809Author:Jay L. DevorePublisher:Cengage Learning
 Statistics for The Behavioral Sciences (MindTap C...StatisticsISBN:9781305504912Author:Frederick J Gravetter, Larry B. WallnauPublisher:Cengage Learning
 Elementary Statistics: Picturing the World (7th E...StatisticsISBN:9780134683416Author:Ron Larson, Betsy FarberPublisher:PEARSON
 The Basic Practice of StatisticsStatisticsISBN:9781319042578Author:David S. Moore, William I. Notz, Michael A. FlignerPublisher:W. H. Freeman
 Introduction to the Practice of StatisticsStatisticsISBN:9781319013387Author:David S. Moore, George P. McCabe, Bruce A. CraigPublisher:W. H. Freeman


