
MATLAB: An Introduction with Applications
6th Edition
ISBN: 9781119256830
Author: Amos Gilat
Publisher: John Wiley & Sons Inc
expand_more
expand_more
format_list_bulleted
Related questions
Question
Hi can you fill out the blanks for me?
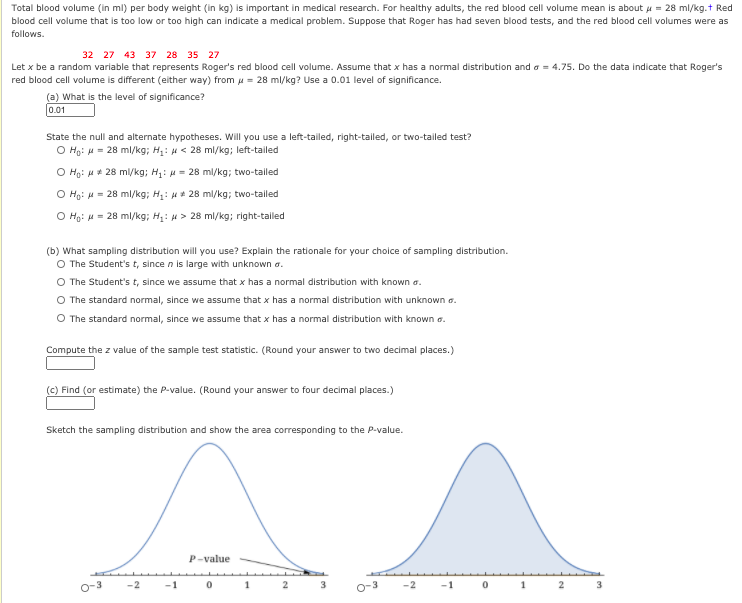

Transcribed Image Text:Total blood volume (in ml) per body weight (in kg) is important in medical research. For healthy adults, the red blood cell volume mean is about u = 28 ml/kg.t Red
blood cell volume that is too low or too high can indicate a medical problem. Suppose that Roger has had seven blood tests, and the red blood cell volumes were as
follows.
32 27 43 37 28 35 27
Let x be a random variable that represents Roger's red blood cell volume. Assume that x has a normal distribution and a = 4.75. Do the data indicate that Roger's
red blood cell volume is different (either way) from u = 28 ml/kg? Use a 0.01 level of significance.
(a) What is the level of significance?
0.01
State the null and alternate hypotheses. Will you use a left-tailed, right-tailed, or two-tailed test?
O Ho: H = 28 ml/kg; H: H< 28 ml/kg; left-tailed
O Ho: u* 28 ml/kg; H: u = 28 ml/kg; two-tailed
O Ho: H = 28 ml/kg; H: 28 ml/kg; two-tailed
O Ho: H = 28 ml/kg; H: 4 > 28 ml/kg; right-tailed
(b) What sampling distribution will you use? Explain the rationale for your choice of sampling distribution.
O The Student's t, since n is large with unknown a.
O The Student's t, since we assume that x has a normal distribution with known a.
O The standard normal, since we assume that x has a normal distribution with unknown a.
O The standard normal, since we assume that x has a normal distribution with known a.
Compute the z value of the sample test statistic. (Round your answer to two decimal places.)
(c) Find (or estimate) the P-value. (Round your answer to four decimal places.)
Sketch the sampling distribution and show the area corresponding to the P-value.
P-value
o-3
-1
2
o-3
-2
1
3
Expert Solution
This question has been solved!
Explore an expertly crafted, step-by-step solution for a thorough understanding of key concepts.

Step by stepSolved in 2 steps with 1 images

Knowledge Booster


Learn more about
Need a deep-dive on the concept behind this application? Look no further. Learn more about this topic, statistics and related others by exploring similar questions and additional content below.Similar questions
arrow_back_ios
arrow_forward_ios
Recommended textbooks for you
- MATLAB: An Introduction with ApplicationsStatisticsISBN:9781119256830Author:Amos GilatPublisher:John Wiley & Sons Inc
 Probability and Statistics for Engineering and th...StatisticsISBN:9781305251809Author:Jay L. DevorePublisher:Cengage Learning
 Statistics for The Behavioral Sciences (MindTap C...StatisticsISBN:9781305504912Author:Frederick J Gravetter, Larry B. WallnauPublisher:Cengage Learning
  Elementary Statistics: Picturing the World (7th E...StatisticsISBN:9780134683416Author:Ron Larson, Betsy FarberPublisher:PEARSON
 The Basic Practice of StatisticsStatisticsISBN:9781319042578Author:David S. Moore, William I. Notz, Michael A. FlignerPublisher:W. H. Freeman
 Introduction to the Practice of StatisticsStatisticsISBN:9781319013387Author:David S. Moore, George P. McCabe, Bruce A. CraigPublisher:W. H. Freeman
MATLAB: An Introduction with Applications
Statistics
ISBN:9781119256830
Author:Amos Gilat
Publisher:John Wiley & Sons Inc
Probability and Statistics for Engineering and th...
Statistics
ISBN:9781305251809
Author:Jay L. Devore
Publisher:Cengage Learning
Statistics for The Behavioral Sciences (MindTap C...
Statistics
ISBN:9781305504912
Author:Frederick J Gravetter, Larry B. Wallnau
Publisher:Cengage Learning
Elementary Statistics: Picturing the World (7th E...
Statistics
ISBN:9780134683416
Author:Ron Larson, Betsy Farber
Publisher:PEARSON
The Basic Practice of Statistics
Statistics
ISBN:9781319042578
Author:David S. Moore, William I. Notz, Michael A. Fligner
Publisher:W. H. Freeman
Introduction to the Practice of Statistics
Statistics
ISBN:9781319013387
Author:David S. Moore, George P. McCabe, Bruce A. Craig
Publisher:W. H. Freeman