MATLAB: An Introduction with Applications
6th Edition
ISBN: 9781119256830
Author: Amos Gilat
Publisher: John Wiley & Sons Inc
expand_more
expand_more
format_list_bulleted
Question

Transcribed Image Text:O
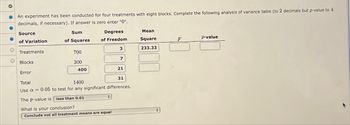
An experiment has been conducted for four treatments with eight blocks. Complete the following analysis of variance table (to 2 decimals but p-value to 4
decimals, if necessary). If answer is zero enter "0".
Source
of Variation
O
O Blocks
Treatments
Error
Sum
of Squares
700
300
400
Degrees
of Freedom
3
7
21
Total
31
1400
Use a = 0.05 to test for any significant differences.
The p-value is less than 0.01
What is your conclusion?
Conclude not all treatment means are equal
Mean
Square
233.33
F
P-value
Expert Solution
This question has been solved!
Explore an expertly crafted, step-by-step solution for a thorough understanding of key concepts.
Step by stepSolved in 3 steps with 11 images

Knowledge Booster
Similar questions
- You want to obtain a sample to esimate a population proportion. Based on previous evidence you believe the population proportion is approximately p*=21%. You would loke to be 99.9% confident that you estomate within 1% of the true population proportion. How large of a sample size is required?arrow_forwardPlease helparrow_forwardYou want to compare differences in prior arrests across ethnicity in your study, you measured ethnicity as white =0 black =1 hispanic=2, and other =3. Prior arrests was recorded as the number of prior arrests. which test would you perform to see if arrests differ across diffrent ethnic categories? A. ANOVA B. T-testarrow_forward
- The p-value is 0.0620, State the conclusion in terms of the claim and whether you would recommend shutting down the car factory with given p-value?arrow_forwardCalculate the correct t-statistics based on the information below. X1 = 200 X2 = 198 n1 = 17 n2 = 17 s1 = 2.45 s2 = 2.35 Let us assume that two groups of students at Tarleton are being compared on their average weights. Do you think the groups are different in terms of weight (measured in pounds)?arrow_forwardA survey of 200 senior citizens was undertaken and it was found that 26 of them had the flu vaccine this year. Do these data suggest that the proportion of senior citizens who get the flu vaccine is significantly less than 21 % ? Test at a = 0.10. Round your answers to three decimal places, and round any interim calculations to four decimal places. What is the test statistic? -2.7778 Using your answer from the previous question, find the p-value. .0027 What is the critical value for this test? Part 2 of 3arrow_forward
- Hi team, Please provide the answer for the 4 parts of the question, thanks in advance. The last senence says : (please pick the correct lines) "(Fail to reject / Reject ) H0 . There is (Sufficient / Not sufficient) evidence to conclude that the mean lead concentration for all such medicines is (Not / Equal to / Greater than / Less than ) 18 μg/g."arrow_forwardUse the output below to determine if there is a significant difference in the hour spent emailing between the two group if T0 =0.290arrow_forwardThe following equation was estimated by OLS: Unipa = 1.392 - 0.0135 psperc + 0..00148 sat n = 4,137, R2 = 0.273 Where unipa is measured on a four-point scale, psperc is the percentile in the post- sixteen class (defined so that, for example, psperc =5 means the top 5% of the class), and sat is the combined maths and verbal scores on the student achievement test.arrow_forward
- You want to obtain a sample to estimate a population proportion. Based on previous evidence, you believe the population proportion is approximately p 0.32. You would like to be 96% confident that your esimate is within 4% of the true population proportion. How large of a sample size is required? n =arrow_forwardyour car is more crowded than you think. table 5.8 reports results from a 1969 personal transportation survey on "home-to-work" trips in metropolitan areas. The survey stated that the average car occupancy was 1.4 people. check that calculation.arrow_forward
arrow_back_ios
arrow_forward_ios
Recommended textbooks for you
 MATLAB: An Introduction with ApplicationsStatisticsISBN:9781119256830Author:Amos GilatPublisher:John Wiley & Sons Inc
 Probability and Statistics for Engineering and th...StatisticsISBN:9781305251809Author:Jay L. DevorePublisher:Cengage Learning
 Statistics for The Behavioral Sciences (MindTap C...StatisticsISBN:9781305504912Author:Frederick J Gravetter, Larry B. WallnauPublisher:Cengage Learning
 Elementary Statistics: Picturing the World (7th E...StatisticsISBN:9780134683416Author:Ron Larson, Betsy FarberPublisher:PEARSON
 The Basic Practice of StatisticsStatisticsISBN:9781319042578Author:David S. Moore, William I. Notz, Michael A. FlignerPublisher:W. H. Freeman
 Introduction to the Practice of StatisticsStatisticsISBN:9781319013387Author:David S. Moore, George P. McCabe, Bruce A. CraigPublisher:W. H. Freeman

MATLAB: An Introduction with Applications
Statistics
ISBN:9781119256830
Author:Amos Gilat
Publisher:John Wiley & Sons Inc

Probability and Statistics for Engineering and th...
Statistics
ISBN:9781305251809
Author:Jay L. Devore
Publisher:Cengage Learning

Statistics for The Behavioral Sciences (MindTap C...
Statistics
ISBN:9781305504912
Author:Frederick J Gravetter, Larry B. Wallnau
Publisher:Cengage Learning

Elementary Statistics: Picturing the World (7th E...
Statistics
ISBN:9780134683416
Author:Ron Larson, Betsy Farber
Publisher:PEARSON

The Basic Practice of Statistics
Statistics
ISBN:9781319042578
Author:David S. Moore, William I. Notz, Michael A. Fligner
Publisher:W. H. Freeman

Introduction to the Practice of Statistics
Statistics
ISBN:9781319013387
Author:David S. Moore, George P. McCabe, Bruce A. Craig
Publisher:W. H. Freeman