
MATLAB: An Introduction with Applications
6th Edition
ISBN: 9781119256830
Author: Amos Gilat
Publisher: John Wiley & Sons Inc
expand_more
expand_more
format_list_bulleted
Related questions
Topic Video
Question
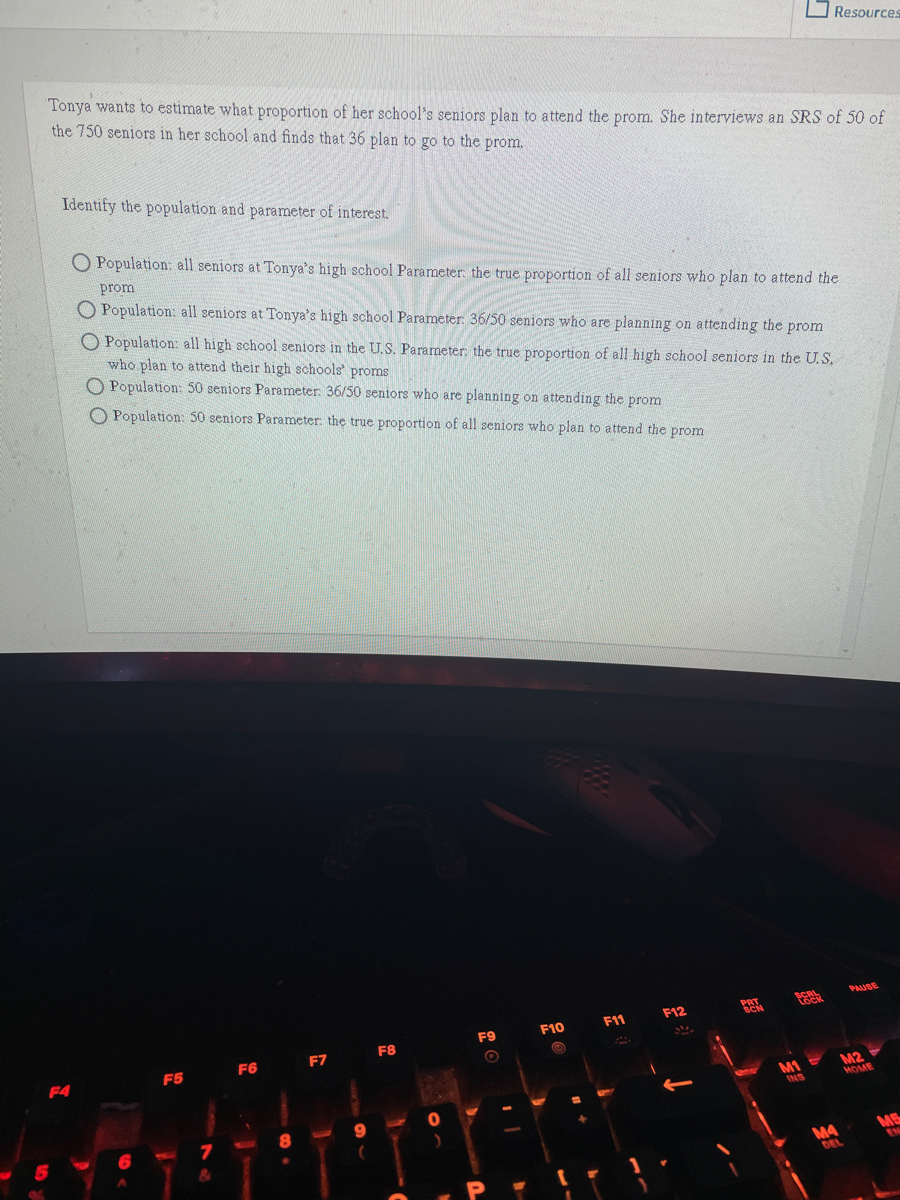

Transcribed Image Text:O Resources
Tonya wants to estimate what proportion of her school's seniors plan to attend the prom. She interviews an SRS of 50 of
the 750 seniors in her school and finds that 36 plan to go to the prom.
Identify the population and parameter of interest.
O Population: all seniors at Tonya's high school Parameter, the true proportion of all seniors who plan to attend the
prom
O Population: all seniors at Tonya's high school Parameter. 36/50 seniors who are planning on attending the prom
O Population: all high school seniors in the U.S. Parameter. the true proportion of all high school seniors in the U.S.
who plan to attend their high schools' proms
O Population: 50 seniors Parameter. 36/50 seniors who are planning on attending the prom
O Population: 50 seniors Parameter. the true proportion of all seniors who plan to attend the prom
PAUSE
F12
PRT
F10
F11
F9
F6
F7
F8
F4
F5
M1
INS
M2
HOME
M5
MA
TH
DEL
Expert Solution
arrow_forward
Step 1
Given a population of 750 seniors and SRS of 50 in which 36 plan to go the the prom.

Trending nowThis is a popular solution!

Step by stepSolved in 3 steps

Knowledge Booster


Learn more about
Need a deep-dive on the concept behind this application? Look no further. Learn more about this topic, statistics and related others by exploring similar questions and additional content below.Similar questions
- Ex. 1 A survey of 80 r/s California State University students indicates that 52 of them work. An independent survey of 40 University of California students indicates that 20 of them work. Construct a 95% c.i. for the difference between the overall percent of CSU students who work and the UC percent.arrow_forwardThe last digit of the heights of 40 statistics students were obtained as part of an experiment conducted for a class. Use the following frequency distribution to construct a histogram. What can be concluded from the distribution of the digits? Specifically, do the heights appear to be reported or actually measured? Digit Frequency 0 1 2 4 3 1 Choose the correct histogram below. O A. O B. O C. O D. TH 0123456789 HOLG 12- HH 123456789 Are the data reported or measured? O A. The data appears to be measured. The heights occur with roughly the same frequency. O B. The data appears to be measured. Certain heights occur a disproportionate number of times.arrow_forward2. A real estate expert wanted to find the relationship between the sale price of houses and various characteristics of the houses. He collected data on five variables, recorded in the table, for 12 houses that were sold recently. The five variables are: Sale price of a house in thousands of dollars. Size of the lot in acres. Price: Lot Size: Living Area: Living area in square feet. Age: Type of house: town house (T) or Villa (V) Age of a house in years. Price Lot Size Living Area Age Туре of house 255 1.4 2500 8 T 178 0.9 2250 12 T T. T. T. 263 1.8 2900 5 0.7 2.6 127 1800 24 305 3200 10 164 1.2 2400 18 245 2.1 2700 T V 146 1.1 2050 28 287 2.8 2850 13 V 189 1.6 2600 9 211 1.7 2300 8 V 123 0.5 1700 11 V a) Find the regression equation for the town house b) Find the regression equation for the Villa c) What is the price of a town house with a lot size of 1.3, living area of 1800, and is 7 years old? EBBBBE A> >}>l> >{arrow_forward
- Virginia polled a large sample of individuals to find the percentage of students with known food allergies and the percentage of students without known food allergies. Which of the following could sufficiently display the data if only the two given categories are to be included? Select the correct answer below: bar graph pie chart either a pie chart or a bar graph neither a pie chart nor a bar grapharrow_forwardtatcrunch 2 Refer to the accompanying data display that results from a sample of airport data speeds in Mbps. Complete parts (a) through (c) below. Click the icon to view at distribution table. W S X H d a. What is the number of degrees of freedom that should be used for finding the critical value t/2? df = 0 (Type a whole number.) b. Find the critical value t/2 corresponding to a 95% confidence level. ¹ x/2 = (Round to two decimal places as needed.) c. Give a brief general description of the number of degrees of freedom. Tech help # 3 OA. The number of degrees of freedom for a collection of sample data is the total number of sample values. OB. The number of degrees of freedom for a collection of sample data is the number of sample values that can vary after certain restrictions have been imposed on all data values. 20 E D с F3 $ 4 888 R F V % 5 T G F5 B MacBook Air Y H 8 7 N F7 TEE U J 00* 8 ►II M F8 9 K O L command F10 P { alt option (13.046,22.15) x=17.598 Sx=16.01712719 n=50 1 Next…arrow_forwardA city with 9800 registered voters has 5 candidates running for the city Mayor. Last week, 350 voters were randomly chosen and asked if they would vote for Peter Griffin (one of the candidates), and 22 % responded they would. On the election day, 35 % of the registered voters actually voted for Peter Griffin.Identify the parameter. 35 % 350 9800 5 22 % Unknownarrow_forward
- complaint and, if so, whether the complaint was medical or nonmedical in nature. After a year, a tally from these patients was collected to count number who left the HMO voluntarily. Here are the data on the total number in each group and the number who voluntarily left the HMO: No complaint Medical complaint Nonmedical complaint Total A certain health maintenance organization (HMO) wishes to study why patients leave the HMO. A SRS of 423 patients was taken. Data was collected on whether a patient had filed a 177 111 135 Left 64 27 50 If the null hypothesis is Ho : pı = P2 = P3 and using a = 0.05, then do the following: (a) Find the expected number of people with no complaint who leave the HMO: (b) Find the expected number of people with a medical complaint who leave the HMO: (c) Find the expected number of people with a nonmedical complaint who leave the HMO: (d) Find the test statistic: (e) Find the degrees of freedom: (f) Find the critical value: (g) The final conclusion is OA. We…arrow_forwardDetermine whether the underlined value is a parameter or a statistic. Telephone interviews of 1,502 adults 18 years of age or older found that only 69% could identify the current vice-president. Is the value a parameter or a statistic? OA. The value is a statistic because the 1,502 adults 18 years of age or older are a population. B. The value is a parameter because the 1,502 adults 18 years of age or older are a population. C. The value is a statistic because the 1,502 adults 18 years of age or older are a sample. OD. The value is a parameter because the 1,502 adults 18 years of age or older are a sample.arrow_forward
arrow_back_ios
arrow_forward_ios
Recommended textbooks for you
- MATLAB: An Introduction with ApplicationsStatisticsISBN:9781119256830Author:Amos GilatPublisher:John Wiley & Sons Inc
 Probability and Statistics for Engineering and th...StatisticsISBN:9781305251809Author:Jay L. DevorePublisher:Cengage Learning
 Statistics for The Behavioral Sciences (MindTap C...StatisticsISBN:9781305504912Author:Frederick J Gravetter, Larry B. WallnauPublisher:Cengage Learning
  Elementary Statistics: Picturing the World (7th E...StatisticsISBN:9780134683416Author:Ron Larson, Betsy FarberPublisher:PEARSON
 The Basic Practice of StatisticsStatisticsISBN:9781319042578Author:David S. Moore, William I. Notz, Michael A. FlignerPublisher:W. H. Freeman
 Introduction to the Practice of StatisticsStatisticsISBN:9781319013387Author:David S. Moore, George P. McCabe, Bruce A. CraigPublisher:W. H. Freeman
MATLAB: An Introduction with Applications
Statistics
ISBN:9781119256830
Author:Amos Gilat
Publisher:John Wiley & Sons Inc
Probability and Statistics for Engineering and th...
Statistics
ISBN:9781305251809
Author:Jay L. Devore
Publisher:Cengage Learning
Statistics for The Behavioral Sciences (MindTap C...
Statistics
ISBN:9781305504912
Author:Frederick J Gravetter, Larry B. Wallnau
Publisher:Cengage Learning
Elementary Statistics: Picturing the World (7th E...
Statistics
ISBN:9780134683416
Author:Ron Larson, Betsy Farber
Publisher:PEARSON
The Basic Practice of Statistics
Statistics
ISBN:9781319042578
Author:David S. Moore, William I. Notz, Michael A. Fligner
Publisher:W. H. Freeman
Introduction to the Practice of Statistics
Statistics
ISBN:9781319013387
Author:David S. Moore, George P. McCabe, Bruce A. Craig
Publisher:W. H. Freeman