
MATLAB: An Introduction with Applications
6th Edition
ISBN: 9781119256830
Author: Amos Gilat
Publisher: John Wiley & Sons Inc
expand_more
expand_more
format_list_bulleted
Related questions
Question
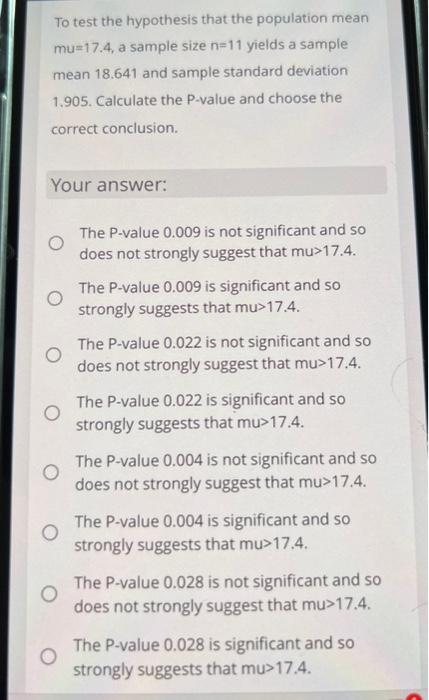

Transcribed Image Text:To test the hypothesis that the population mean
mu 17.4, a sample size n=11 yields a sample
mean 18.641 and sample standard deviation
1.905. Calculate the P-value and choose the
correct conclusion.
Your answer:
O
O
O
The P-value 0.009 is not significant and so
does not strongly suggest that mu>17.4.
The P-value 0.009 is significant and so
strongly suggests that mu>17.4.
The P-value 0.022 is not significant and so
does not strongly suggest that mu>17.4.
The P-value 0.022 is significant and so
strongly suggests that mu>17.4.
The P-value 0.004 is not significant and so
does not strongly suggest that mu>17.4.
The P-value 0.004 is significant and so
strongly suggests that mu>17.4.
The P-value 0.028 is not significant and so
does not strongly suggest that mu>17.4.
The P-value 0.028 is significant and so
strongly suggests that mu>17.4.
Expert Solution
This question has been solved!
Explore an expertly crafted, step-by-step solution for a thorough understanding of key concepts.

Step by stepSolved in 3 steps with 1 images

Knowledge Booster

Similar questions
- Consider a large population with?=67 and ?=6. Assuming ?/?≤0.05, find the mean and standard deviation of the sample mean, x ,a. for a sample of size 21 ux= ox= b. For a sample of size 62 ux= ox=arrow_forwardA scientist studying babies born prematurely would like to obtain a n estimate for the mean birth weight.arrow_forwardThe ages of a group of 139 randomly selected adult females have a standard deviation of 17.2 years. Assume that the ages of female statistics students have less variation than ages of females in the general population, so let o = 17.2 years for the sample size calculation. How many female statistics student ages must be obtained in order to estimate the mean age of all female statistics students? Assume that we want 98% confidence that the sample mean is within one-half year of the population mean, The required sample size is (Type a whole number.)arrow_forward
- The daily sleep duration among college students is normally distributed with a mean of 8.13 and standard deviation of 1.87. You want to use a sample size such that 95% of the averages fall within ±15±15 minutes (.25 of an hour) of the true mean of 8.13. Determine the smallest number of students you need to sample.arrow_forwardThe ages of a group of 153 randomly selected adult females have a standard deviation of 17.8 years. Assume that the ages of female statistics students have less variation than ages of females in the general population, so let o = 17.8 years for the sample size calculation. How many female statistics student ages must be obtained in order to estimate the mean age of all female statistics students? Assume that we want 98% confidence that the sample mean is within one-half year of the population mean. Does it seem reasonable to assume that the ages of female statistics students have less variation than ages of females in the general population? The required sample size is . (Round up to the nearest whole number as needed.)arrow_forwardThe ages of a group of 149 randomly selected adult females have a standard deviation of 16.5 years. Assume that the ages of female statistics students have less variation than ages of females in the general population, so let σ=16.5 years for the sample size calculation. How many female statistics student ages must be obtained in order to estimate the mean age of all female statisticsstudents? Assume that we want 90% confidence that the sample mean is within one-half year of the population mean. Does it seem reasonable to assume that the ages of female statistics students have less variation than ages of females in the general population? Question content area bottom Part 1 The required sample size is enter your response here.arrow_forward
- The National Weather Service says that the mean daily high temperature for October in a large mid-western city is 56°F. A local weather service suspects that this value is not accurate and wants to perform a hypothesis test to determine whether the mean is actually lower than 56°F. A sample of mean daily high temperatures for October over the past 37 years yields a sample mean of 54o F. Assume that the population standard deviation is 5.6° F. Perform the hypothesis test at the 1% significance level. STEP 1. H0: µ:____ ______o _____: H1: µ ____ o NOTE: For ≠ enter /= STEP 2. This test is (e) left-tailed, (f) two-tailed or (g) right-tailed test. This test is:___ (enter e, f or g) STEP 3. The critical value (s) is Use the following chart to identify the critical value (s) Left-tailed Two-tailed Right tailed α =10% z = -1.28 (A) z=∓1.65 (B)…arrow_forwardThe ages of a group of 156 randomly selected adult females have a standard deviation of 17.4 years. Assume that the ages of female statistics students have less variation than ages of females in the general population, so let σ=17.4 years for the sample size calculation. How many female statistics student ages must be obtained in order to estimate the mean age of all female statistics students? Assume that we want 98% confidence that the sample mean is within one-half year of the population mean. Does it seem reasonable to assume that the ages of female statistics students have less variation than ages of females in the general population?arrow_forwardThe ages of a group of 132 randomly selected adult females have a standard deviation of 16.1 years. Assume that the ages of female statistics students have less variation than ages of females in the general population, so let σ=16.1 years for the sample size calculation. How many female statistics student ages must be obtained in order to estimate the mean age of all female statistics students? Assume that we want 95% confidence that the sample mean is within one-half year of the population mean. Does it seem reasonable to assume that the ages of female statistics students have less variation than ages of females in the general population?The required sample size isarrow_forward
- The ages of a group of 134 randomly selected adult females have a standard deviation of 18.2 years. Assume that the ages of female statistics students have less variation than ages of females in the general population, so let o = 18.2 years for the sample size calculation. How many female statistics student ages must be obtained in order to estimate the mean age of all female statistics students? Assume that we want 98% confidence that the sample mean is within one-half year of the population mean. Does it seem reasonable to assume that the ages of female statistics students have less variation than ages of females in the general population? The required sample size is 7194 . (Round up to the nearest whole number as needed.) Does it seem reasonable to assume that the ages of female statistics students have less variation than ages of females in the general population? A. No, because there is no age difference between the population of statistics students and the general population. B.…arrow_forwardThe ages of a group of 134 randomly selected adult females have a standard deviation of 18.2 years. Assume that the ages of female statistics students have less variation than ages of females in the general population, so let o = 18.2 years for the sample size calculation. How many female statistics student ages must be obtained in order to estimate the mean age of all female statistics students? Assume that we want 98% confidence that the sample mean is within one-half year of the population mean. Does it seem reasonable to assume that the ages of female statistics students have less variation than ages of females in the general population? The required sample size is. (Round up to the nearest whole number as needed.)arrow_forward
arrow_back_ios
arrow_forward_ios
Recommended textbooks for you
- MATLAB: An Introduction with ApplicationsStatisticsISBN:9781119256830Author:Amos GilatPublisher:John Wiley & Sons Inc
 Probability and Statistics for Engineering and th...StatisticsISBN:9781305251809Author:Jay L. DevorePublisher:Cengage Learning
 Statistics for The Behavioral Sciences (MindTap C...StatisticsISBN:9781305504912Author:Frederick J Gravetter, Larry B. WallnauPublisher:Cengage Learning
  Elementary Statistics: Picturing the World (7th E...StatisticsISBN:9780134683416Author:Ron Larson, Betsy FarberPublisher:PEARSON
 The Basic Practice of StatisticsStatisticsISBN:9781319042578Author:David S. Moore, William I. Notz, Michael A. FlignerPublisher:W. H. Freeman
 Introduction to the Practice of StatisticsStatisticsISBN:9781319013387Author:David S. Moore, George P. McCabe, Bruce A. CraigPublisher:W. H. Freeman
MATLAB: An Introduction with Applications
Statistics
ISBN:9781119256830
Author:Amos Gilat
Publisher:John Wiley & Sons Inc
Probability and Statistics for Engineering and th...
Statistics
ISBN:9781305251809
Author:Jay L. Devore
Publisher:Cengage Learning
Statistics for The Behavioral Sciences (MindTap C...
Statistics
ISBN:9781305504912
Author:Frederick J Gravetter, Larry B. Wallnau
Publisher:Cengage Learning
Elementary Statistics: Picturing the World (7th E...
Statistics
ISBN:9780134683416
Author:Ron Larson, Betsy Farber
Publisher:PEARSON
The Basic Practice of Statistics
Statistics
ISBN:9781319042578
Author:David S. Moore, William I. Notz, Michael A. Fligner
Publisher:W. H. Freeman
Introduction to the Practice of Statistics
Statistics
ISBN:9781319013387
Author:David S. Moore, George P. McCabe, Bruce A. Craig
Publisher:W. H. Freeman