MATLAB: An Introduction with Applications
6th Edition
ISBN: 9781119256830
Author: Amos Gilat
Publisher: John Wiley & Sons Inc
expand_more
expand_more
format_list_bulleted
Question

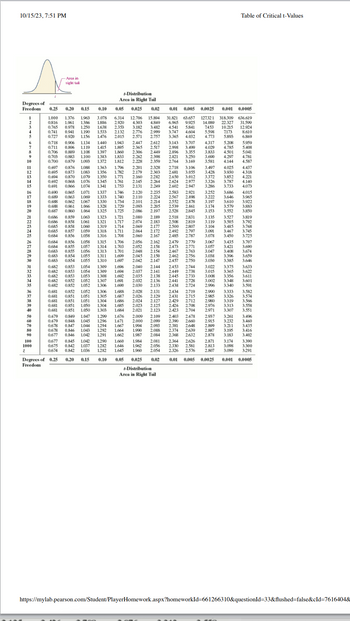
Transcribed Image Text:10/15/23.7:51 PM
Degrees of
Freedom 0.25 0.20 0.15 0.10
0.765
-Area in
right tail
0.711
0.706
1.386
0.978 1.250 1.638
82 8位08 5
6789W HYBHE KD89 12345 ADAWM ALB科5 M初珞= 研推 0
22222 22222 22222 22222
16 14 36 106 12 138 31 10 10 15 11 138 10 10826 106868 68586 008 13
0906 1134
0.677 0.845 1042 1206
1-Distribution
Area in Right
Degrees of 0.25 0.20 01 01 0.05 0.025
Freedom
ove
NİNNİNİN cicicicicicicicicici ciddi ddddddici
Sm 98771 R18N81W
565
Distribution
Area in Right Tail
0.01 0.005 0.0025
558
hmmmmin Sains innin
iiiNN NNNNN iiiii nnnnnnnn
15250 USAST AND184 838应商
0.02 0.01 0.005
22 22 19
2.871
3.174
https://mylab.pearson.com/Student/PlayerHomework.aspx?homeworkId=661266310&questionId=33&flushed=false&cId=7616404&
Table of Critical t-Values
000年 0.001 0.0005
www

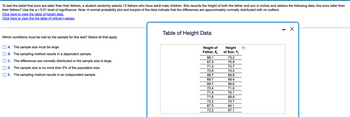
Transcribed Image Text:To test the belief that sons are taller than their fathers, a student randomly selects 13 fathers who have adult male children. She records the height of both the father and son in inches and obtains the following data. Are sons taller than
their fathers? Use the α = 0.01 level of significance. Note: A normal probability plot and boxplot of the data indicate that the differences are approximately normally distributed with no outliers.
Click here to view the table of height data.
Click here to view the the table of critical t-values.
Which conditions must be met by the sample for this test? Select all that apply.
A. The sample size must be large.
B. The sampling method results in a dependent sample.
C. The differences are normally distributed or the sample size is large.
D. The sample size is no more than 5% of the population size.
E. The sampling method results in an independent sample.
Table of Height Data
Height
Height of
Father, Xi of Son, Yi
68.1
73.2
67.3
70.9
73.7
74.4
69.9
69.4
69.8
71.9
70.1
69.9
70.7
64.1
67.1
71.3
72.6
68.7
68.7
69.7
72.4
71.4
71.6
73.2
67.5
72.2
X
Expert Solution
This question has been solved!
Explore an expertly crafted, step-by-step solution for a thorough understanding of key concepts.
This is a popular solution
Trending nowThis is a popular solution!
Step by stepSolved in 4 steps with 18 images

Knowledge Booster
Similar questions
- Suppose you have a distribution with a mean equal to 10, median equal to 20, and mode equal to 30. Positive skew, negative skew, or no skew?arrow_forwardTo test the belief that sons are taller than their fathers, a student randomly selects 13 fathers who have adult male children. She records the height of both the father and son in inches and obtains the following data. Are sons taller than their fathers? Use the x = 0.05 level of significance. Note: A normal probability plot and boxplot of the data indicate that the differences are approximately normally distributed with no outliers. Click here to view the table of data. Click here to view the table of critical t-values. Which conditions must be met by the sample for this test? Select all that apply. A. The sampling method results in a dependent sample. B. The sampling method results in an independent sample. C. The sample size is no more than 5% of the population size. D. The differences are normally distributed or the sample size is large. E. The sample size must be large. Let d₁=X₁ - Y₁. Write the hypotheses for the test. Ho: H₁: ▼ Table of height data Height of Father, X₁ 68.3…arrow_forwardSuppose that the distance of fly balls hit to the outfield (in baseball) is normally distributed with a mean of 242 feet and a standard deviation of 46 feet.Use your graphing calculator to answer the following questions. Write your answers in percent form. Round your answers to the nearest tenth of a percent. a) If one fly ball is randomly chosen from this distribution, what is the probability that this ball traveled fewer than 204 feet? P(fewer than 204 feet) = ____% b) If one fly ball is randomly chosen from this distribution, what is the probability that this ball traveled more than 234 feet? P(more than 234 feet) = ______%arrow_forward
- The scores of individual students on the American College Testing (ACT), a college readiness assessment, have a Normal distribution with a mean of 18.6 and a standard deviation of 6.0. At Northside High, 36 seniors take the test. Assume the scores at this school have the same distribution as national scores. What is the mean of the sampling distribution of the sample mean score for a random sample of 36 students? 0 1 0 6arrow_forwardIf actual period demand varies from the forecast by more than 3MAD, this indicates: there is 3% chance that the forecast is wrong. there is a 98% chance that the forecast is wrong. there is a 97% chance that the forecast is wrong. there is a 3% chance that the forecast is correct Moving to the next question prevents changes to this answer:arrow_forwardBeef Consumption. According to Food Consumption, Prices, and Expenditures, published by the U.S. Department of Agriculture, the mean consumption of beef per person in 2011 was 57.5 lb. A sample of 40 people taken this year yielded the data, in pounds, on last year’s beef consumption given on the WeissStats site. Use the technology of your choice to do the following. a. Obtain a normal probability plot, a boxplot, a histogram, and a stem-and-leaf diagram of the data on beef consumptions. b. Decide, at the 5% significance level, whether last year’s mean beef consumption is less than the 2011 mean of 57.5 lb. Apply the onemean t-test. c. The sample data contain four potential outliers: 0, 0, 0, and 13. Remove those four observations, repeat the hypothesis test in part (b), and compare your result with that obtained in part (b). d. Assuming that the four potential outliers are not recording errors, comment on the advisability of removing them from the sample data before performing the…arrow_forward
- In 1995, the median price of a PC was $1200. Suppose that a random sample of100 persons who bought their PCs during that year recorded the amount spent (byeach of them) on his/her PC. State the approximate sampling distribution of ˆp, theproportion of persons who spent more than $1200 on a PC. Find the probabilitythat more than 60% of this group spent more than $1200. NOTE: Please explain each part, so the problem can be used as a Study Guidearrow_forwardTransforming an entire distribution of scores into z-scores will not change the shape of the distribution. a. True b. Falsearrow_forwardIn a normal distribution, what z-score cuts off the top 65% of the distribution?a. z = 0.7422b. z = 0.2578c. z =0.39d. z = -0.39arrow_forward
- Suppose that the distance of fly balls hit to the outfielder ( in baseball) is normally distributed with a mean of 250 feet and a standard deviation of 50 feet. We randomly sample 49 fly balls.a. In words define the random variable. X________.b. What is the probability that the 49 balls traveled an average at least of 240 feet. Include a complete shaded graph, and write the probability statement. c. Find the 90th percentile of the distribution of the average of 49 fly balls.arrow_forwardA study found that there was 48% chance that the driver fails a breathalyzer test when it is administered on a Friday night. The test is administered to 80 drivers. What distribution that can be used to model the above situation. How many drivers do we expect to fail the testarrow_forwardTo test the belief that sons are taller than their fathers, a student randomly selects 13 fathers who have adult male children. She records the height of both the father and son in inches and obtains the following data. Are sons taller than their fathers? Use the a = 0.025 level of significance. Note: A normal probability plot and boxplot of the data indicate that the differences are approximately normally distributed with no outliers. Click the icon to view the table of data. ... Which conditions must be met by the sample for this test? Select all that apply. D A. The sampling method results in an independent sample. - X O B. The sample size must be large. c. The sampling method results in a dependent sample. Table of height data YD. The sample size is no more than 5% of the population size. Height of Father, X, Height of O Son, Y LE. The differences are normally distributed or the sample size is large. 71.1 76.2 Let d, = X, - Y,. Write the hypotheses for the test. 68.8 72.3 67.9 70.3…arrow_forward
arrow_back_ios
arrow_forward_ios
Recommended textbooks for you
 MATLAB: An Introduction with ApplicationsStatisticsISBN:9781119256830Author:Amos GilatPublisher:John Wiley & Sons Inc
 Probability and Statistics for Engineering and th...StatisticsISBN:9781305251809Author:Jay L. DevorePublisher:Cengage Learning
 Statistics for The Behavioral Sciences (MindTap C...StatisticsISBN:9781305504912Author:Frederick J Gravetter, Larry B. WallnauPublisher:Cengage Learning
 Elementary Statistics: Picturing the World (7th E...StatisticsISBN:9780134683416Author:Ron Larson, Betsy FarberPublisher:PEARSON
 The Basic Practice of StatisticsStatisticsISBN:9781319042578Author:David S. Moore, William I. Notz, Michael A. FlignerPublisher:W. H. Freeman
 Introduction to the Practice of StatisticsStatisticsISBN:9781319013387Author:David S. Moore, George P. McCabe, Bruce A. CraigPublisher:W. H. Freeman

MATLAB: An Introduction with Applications
Statistics
ISBN:9781119256830
Author:Amos Gilat
Publisher:John Wiley & Sons Inc

Probability and Statistics for Engineering and th...
Statistics
ISBN:9781305251809
Author:Jay L. Devore
Publisher:Cengage Learning

Statistics for The Behavioral Sciences (MindTap C...
Statistics
ISBN:9781305504912
Author:Frederick J Gravetter, Larry B. Wallnau
Publisher:Cengage Learning

Elementary Statistics: Picturing the World (7th E...
Statistics
ISBN:9780134683416
Author:Ron Larson, Betsy Farber
Publisher:PEARSON

The Basic Practice of Statistics
Statistics
ISBN:9781319042578
Author:David S. Moore, William I. Notz, Michael A. Fligner
Publisher:W. H. Freeman

Introduction to the Practice of Statistics
Statistics
ISBN:9781319013387
Author:David S. Moore, George P. McCabe, Bruce A. Craig
Publisher:W. H. Freeman