
MATLAB: An Introduction with Applications
6th Edition
ISBN: 9781119256830
Author: Amos Gilat
Publisher: John Wiley & Sons Inc
expand_more
expand_more
format_list_bulleted
Related questions
Question
Question 4
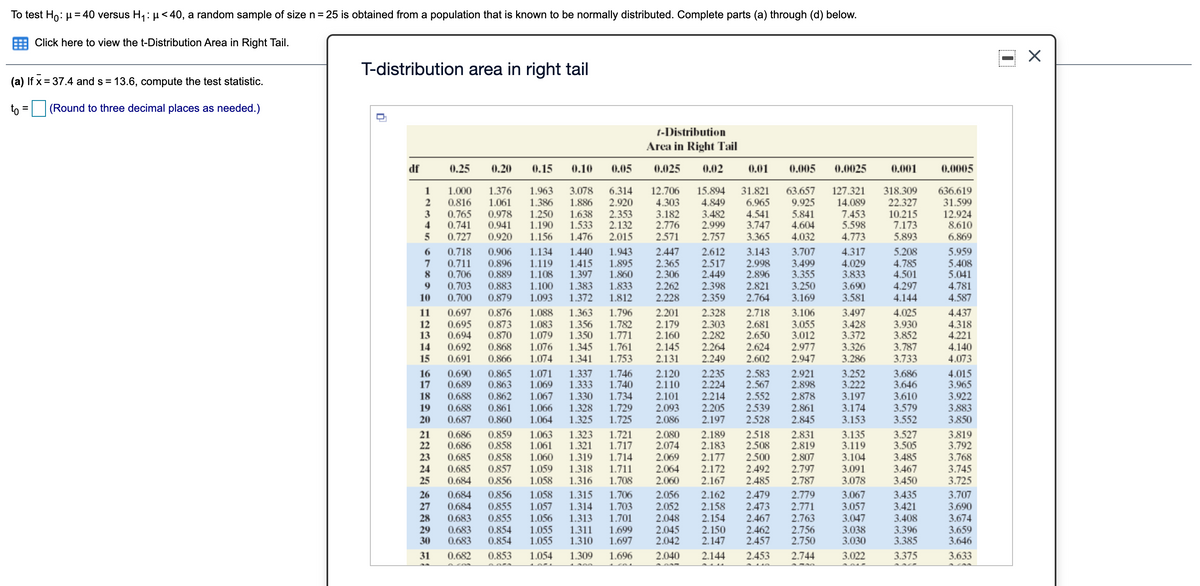

Transcribed Image Text:To test Ho: µ = 40 versus H1: µ < 40, a random sample of sizen=25 is obtained from a population that is known to be normally distributed. Complete parts (a) through (d) below.
Click here to view the t-Distribution Area in Right Tail.
T-distribution area in right tail
(a) If x = 37.4 and s = 13.6, compute the test statistic.
to
(Round to three decimal places as needed.)
t-Distribution
Area in Right Tail
df
0.25
0.20
0.15
0.10
0.05
0.025
0.02
0,01
0.005
0.0025
0.001
0.0005
127.321
14.089
7.453
5.598
1.376
1.963
1.386
1.250
1.190
1.156
12.706
4.303
3.182
2.776
2.571
15.894
4.849
3.482
2.999
2.757
63.657
636.619
31.599
1.000
3.078
6.314
2.920
2.353
2.132
2.015
1
31.821
318.309
6.965
4.541
3.747
3.365
9.925
5.841
4.604
4.032
0.816
2
0.765
0.741
0.727
1.061
0.978
0.941
0.920
22.327
10.215
7.173
5.893
1.886
1.638
1.533
12.924
8.610
6.869
3
1.476
4.773
0.718
7
0.711
8
0.706
1.943
1.895
1.860
3.143
3.707
4.317
5.208
4.785
4.501
4.297
0.906
1.134
5.959
1.440
1.415
1.397
2.447
2.365
2.306
2.612
2.517
2.449
2.398
2.359
6.
4.029
3.833
5.408
5.041
4.781
4.587
0.896
0.889
1.119
1.108
2.998
2.896
3.499
3.355
3.250
3.169
1.833
1.812
9
0.703
0.883
1.100
1.383
2.262
2.821
3.690
10
0.700
0.879
1.093
1.372
2.228
2.764
3.581
4.144
0.697
0.695
0.694
3.106
3.055
3.012
2.977
2.947
4.025
3.930
3.852
3.787
0.876
1.363
1.356
1.350
1.345
1.341
2.201
2.179
2.160
2.328
2.303
2.282
2.264
2.249
4.437
4.318
4.221
4.140
4.073
11
1.088
1.796
1.782
1.771
2.718
3.497
2.681
2.650
2.624
2.602
12
13
0.873
0.870
1.083
1.079
3.428
3.372
1.076
1.074
1.761
1.753
2.145
2.131
14
0.692
0.691
0.868
3.326
15
0.866
3.286
3.733
0.690
0.689
0.865
0.863
0.862
1.071
1.069
1.067
1.066
2.235
2.224
2.921
2.898
2.878
3.252
3.222
3.197
3.686
3.646
16
17
1.337
1.333
1.330
1.746
1.740
1.734
2.120
2.110
2.101
2.583
2.567
2.552
2.539
2.528
4.015
3.965
18
0.688
3.922
2.214
2.205
2.197
3.610
2.093
2.086
3.174
3.153
19
0.688
1.328
1.729
3.579
0.861
0.860
2.861
2.845
3.883
20
0.687
1.064
1.325
1.725
3.552
3.850
0.859
0.858
0.858
1.063
1.061
1.060
1.059
1.058
1.323
1.321
1.319
1.721
1.717
2.080
2.074
2.069
2.831
2.819
2.807
3.135
3.119
3.104
3.091
3.078
3.527
3.505
3.485
21
22
0.686
0.686
0.685
2.189
2.183
2.177
2.172
2.167
2.500
2.492
2.485
2.518
2.508
3.819
3.792
3.768
3.745
23
1.714
0.857
0.856
24
0.685
1.318
1.711
2.064
2.797
3.467
25
0.684
1.316
1.708
2.060
2.787
3.450
3.725
1.058
1.057
1.706
1.703
2.056
2.052
2.048
2.045
2.042
2.779
2.771
0.856
1.315
2.162
2.479
2.473
26
0.684
3.067
3.435
3.707
0.855
0.855
3.057
3.047
3.038
3.030
3.421
3.408
1.314
1.313
1.311
1.310
3.690
3.674
27
0.684
0.683
0.683
0.683
2.158
2.154
1.701
1.699
1.697
2.467
2.462
2.457
2.763
2.756
2.750
28
1.056
29
30
0.854
0.854
1.055
1.055
2.150
2.147
3.396
3.385
3.659
3.646
31
0.682
0.853
1.054
1.309
1.696
2.040
2.144
2.453
2.744
3.022
3.375
3.633
cas
Expert Solution
This question has been solved!
Explore an expertly crafted, step-by-step solution for a thorough understanding of key concepts.

Step by stepSolved in 2 steps

Knowledge Booster

Similar questions
arrow_back_ios
arrow_forward_ios
Recommended textbooks for you
- MATLAB: An Introduction with ApplicationsStatisticsISBN:9781119256830Author:Amos GilatPublisher:John Wiley & Sons Inc
 Probability and Statistics for Engineering and th...StatisticsISBN:9781305251809Author:Jay L. DevorePublisher:Cengage Learning
 Statistics for The Behavioral Sciences (MindTap C...StatisticsISBN:9781305504912Author:Frederick J Gravetter, Larry B. WallnauPublisher:Cengage Learning
  Elementary Statistics: Picturing the World (7th E...StatisticsISBN:9780134683416Author:Ron Larson, Betsy FarberPublisher:PEARSON
 The Basic Practice of StatisticsStatisticsISBN:9781319042578Author:David S. Moore, William I. Notz, Michael A. FlignerPublisher:W. H. Freeman
 Introduction to the Practice of StatisticsStatisticsISBN:9781319013387Author:David S. Moore, George P. McCabe, Bruce A. CraigPublisher:W. H. Freeman
MATLAB: An Introduction with Applications
Statistics
ISBN:9781119256830
Author:Amos Gilat
Publisher:John Wiley & Sons Inc
Probability and Statistics for Engineering and th...
Statistics
ISBN:9781305251809
Author:Jay L. Devore
Publisher:Cengage Learning
Statistics for The Behavioral Sciences (MindTap C...
Statistics
ISBN:9781305504912
Author:Frederick J Gravetter, Larry B. Wallnau
Publisher:Cengage Learning
Elementary Statistics: Picturing the World (7th E...
Statistics
ISBN:9780134683416
Author:Ron Larson, Betsy Farber
Publisher:PEARSON
The Basic Practice of Statistics
Statistics
ISBN:9781319042578
Author:David S. Moore, William I. Notz, Michael A. Fligner
Publisher:W. H. Freeman
Introduction to the Practice of Statistics
Statistics
ISBN:9781319013387
Author:David S. Moore, George P. McCabe, Bruce A. Craig
Publisher:W. H. Freeman