
MATLAB: An Introduction with Applications
6th Edition
ISBN: 9781119256830
Author: Amos Gilat
Publisher: John Wiley & Sons Inc
expand_more
expand_more
format_list_bulleted
Related questions
Question
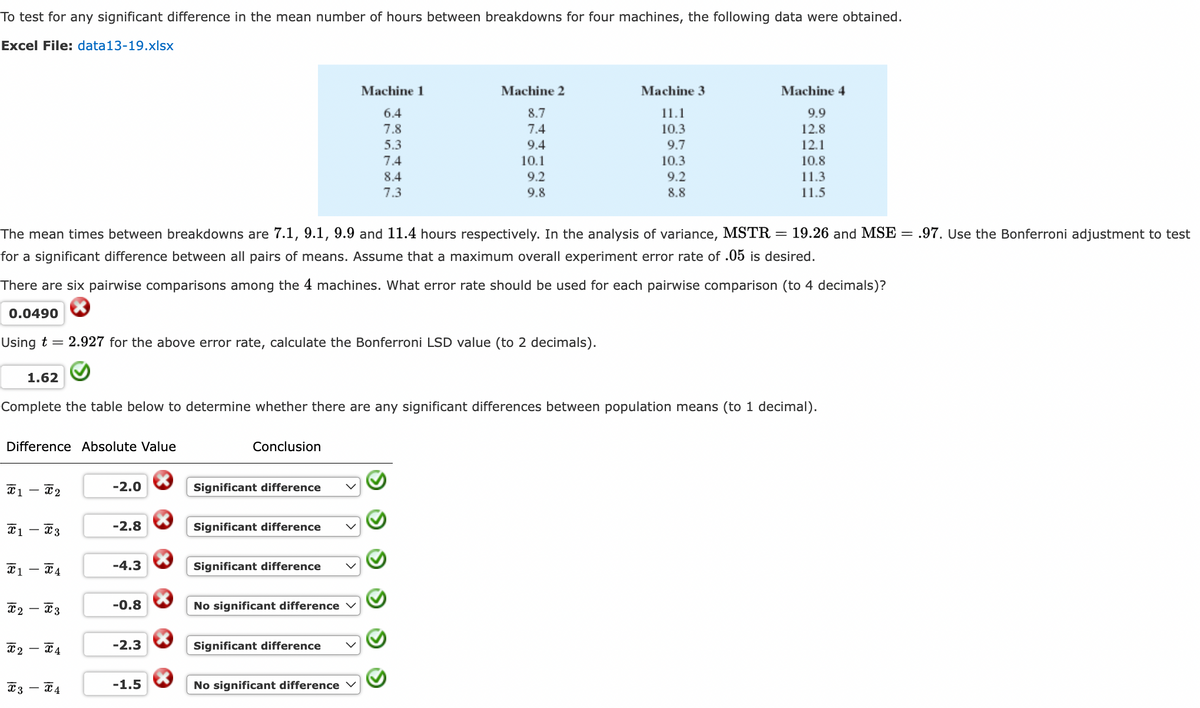

Transcribed Image Text:To test for any significant difference in the mean number of hours between breakdowns for four machines, the following data were obtained.
Excel File: data13-19.xlsx
1.62
Difference Absolute Value
1 - 2
The mean times between breakdowns are 7.1, 9.1, 9.9 and 11.4 hours respectively. In the analysis of variance, MSTR =
for a significant difference between all pairs of means. Assume that a maximum overall experiment error rate of .05 is desired.
There are six pairwise comparisons among the 4 machines. What error rate should be used for each pairwise comparison (to 4 decimals)?
0.0490
Using t = 2.927 for the above error rate, calculate the Bonferroni LSD value (to 2 decimals).
T1-T3
X1 X4
T2
Complete the table below to determine whether there are any significant differences between population means (to 1 decimal).
T3
X2 X4
T3
-
X4
-2.0
-2.8
-4.3
-0.8
-2.3
-1.5
Conclusion
Significant difference
Significant difference
Significant difference
No significant difference
Machine 1
6.4
7.8
5.3
7.4
8.4
7.3
Significant difference
Machine 2
8.7
7.4
9.4
10.1
9.2
9.8
No significant difference
Machine 3
11.1
10.3
9.7
10.3
9.2
8.8
Machine 4
9.9
12.8
12.1
10.8
11.3
11.5
19.26 and MSE = .97. Use the Bonferroni adjustment to test
Expert Solution
This question has been solved!
Explore an expertly crafted, step-by-step solution for a thorough understanding of key concepts.

Step by stepSolved in 3 steps

Knowledge Booster

Similar questions
- A student writes the following interpretation of the slope: "The slope of 0.0577 represents the change in Infant mortality rate for a one unit increase in the child death rate.". Is this interpretation correct? Justify.arrow_forwardThe accompanying data table contains chest deceleration measurements (in g, whereg is the force of gravity) from samples of small, midsize, and large cars. Shown are the technology results for analysis of variance of this data table. Assume that a researcher plans to use a 0.05 significance level to test the claim that the different size categories have the same mean chest deceleration in the standard crash test. Complete parts (a) and (b) below. Click the icon to view the table of chest deceleration measurements A Click the icon to view the table of analysis of variance results. ..... a. What characteristic of the data specifically indicates that one-way analysis of variance should be used? O A. There are three samples of measurements. O B. The population means are approximately normal. O C. The measurements are categorized according to the one characteristic of size. O D. Nothing specifically indicates that one-way analysis of variance should be used. b. If the objective is to test…arrow_forwardThe number of ornaments placed on trees is recorded. The results are as follows: 26 26 22 29 24 30 26 34 21 24 20 31 20 35 32 33 26 26 29 29 Find the Mean, Median, Mode, Midrange, Variance and Standard Deviation of the data.Round to 2 decimal places if necessary. Mean: Median: Mode: Midrange: Variance: Standard Deviation:arrow_forward
- A physical therapist wanted to know whether the mean step pulse of men was less than the mean step pulse of women. She randomly selected 54 men and 75 women to participate in the study. Each subject was required to step up and down a 6-inch platform. The pulse of each subject was then recorded. The following results were obtained. N Mean StDev SE Mean Men Women 95% Cl for mu Men - mu Women - 9.81, - 0.79) T-Test mu Men = mu Women (vs H2 Oc. Họ: H1 = H2; Hai H1arrow_forwardChoose the appropriate statistical test. When computing, be sure to round each answer as indicated. A dentist wonders if depression affects ratings of tooth pain. In the general population, using a scale of 1-10 with higher values indicating more pain, the average pain rating for patients with toothaches is 6.8. A sample of 30 patients that show high levels of depression have an average pain rating of 7.1 (variance 0.8). What should the dentist determine? 1. Calculate the estimated standard error. (round to 3 decimals). [st.error] 2. What is thet-obtained? (round to 3 decimals). 3. What is the t-cv? (exact value) 4. What is your conclusion? Only type "Reject" or Retain"arrow_forwardW 1. X A tablet computer manufacturer claims that its batteries last an average of 10.5 hours when playing videos. The quality control department randomly selects 20 tablets from each day's production and tests the batteries by playing a video repeatedly until the battery dies. The quality control department will reject the batteries from that day's production run if the mean battery life is less than 10.5 hours. Here are the data from one day: 10.3 10.0 10.3 10.6 10.5 10.3 10.1 10.6 11.5 10.3 10.3 12.7 10.6 11.3 13.9 12.5 12.4 10.8 10.2 12.2 The quality control department will test the hypotheses where p true mean battery life (in hours) while playing videos for tablets made during that day. Check that the conditions for performing the test are met. Assume the population is normally distributed. 3 e d C Ho:μ = 50 Ha:μl < 50 $ 4 f 25 % V t 6 (6 b Y h ∞ 7 u n * 00 8 ¡ m ( 9 k O Sign out 1 р Mar 29 7arrow_forwardA survey was given to 357 people asking whether people like dogs and/or cats. 172 said they like dogs 169 said they like cats 86 sald they don't like cats or dogs. How many said they liked both cats and dogs? people liked both cats and dogs.arrow_forwardcan someone answer 3 and 5? please and thanksarrow_forwardRefer to the below table. Using an alpha = 0.05, test the claim that IQ scores are the same for children in three different blood lead level groups: low lead level, medium lead level, and high lead level). One-Way Analysis of Variance Summary Table for IQ Measurements for Children among Three Blood Lead Level Groups: Low Lead Level, Medium Lead Level, and High Lead Level. Source df SS MS F p Between-group (treatment) 2 469.1827 2677.864 2.30 0.104 Within-group (error) 118 203.6918 11745.05 Total 120arrow_forwardarrow_back_iosarrow_forward_ios
Recommended textbooks for you
- MATLAB: An Introduction with ApplicationsStatisticsISBN:9781119256830Author:Amos GilatPublisher:John Wiley & Sons Inc
 Probability and Statistics for Engineering and th...StatisticsISBN:9781305251809Author:Jay L. DevorePublisher:Cengage Learning
 Statistics for The Behavioral Sciences (MindTap C...StatisticsISBN:9781305504912Author:Frederick J Gravetter, Larry B. WallnauPublisher:Cengage Learning
  Elementary Statistics: Picturing the World (7th E...StatisticsISBN:9780134683416Author:Ron Larson, Betsy FarberPublisher:PEARSON
 The Basic Practice of StatisticsStatisticsISBN:9781319042578Author:David S. Moore, William I. Notz, Michael A. FlignerPublisher:W. H. Freeman
 Introduction to the Practice of StatisticsStatisticsISBN:9781319013387Author:David S. Moore, George P. McCabe, Bruce A. CraigPublisher:W. H. Freeman
MATLAB: An Introduction with Applications
Statistics
ISBN:9781119256830
Author:Amos Gilat
Publisher:John Wiley & Sons Inc
Probability and Statistics for Engineering and th...
Statistics
ISBN:9781305251809
Author:Jay L. Devore
Publisher:Cengage Learning
Statistics for The Behavioral Sciences (MindTap C...
Statistics
ISBN:9781305504912
Author:Frederick J Gravetter, Larry B. Wallnau
Publisher:Cengage Learning
Elementary Statistics: Picturing the World (7th E...
Statistics
ISBN:9780134683416
Author:Ron Larson, Betsy Farber
Publisher:PEARSON
The Basic Practice of Statistics
Statistics
ISBN:9781319042578
Author:David S. Moore, William I. Notz, Michael A. Fligner
Publisher:W. H. Freeman
Introduction to the Practice of Statistics
Statistics
ISBN:9781319013387
Author:David S. Moore, George P. McCabe, Bruce A. Craig
Publisher:W. H. Freeman