
MATLAB: An Introduction with Applications
6th Edition
ISBN: 9781119256830
Author: Amos Gilat
Publisher: John Wiley & Sons Inc
expand_more
expand_more
format_list_bulleted
Related questions
Question
To predict blood alcohol content of a student who drank 5 beers will be about?
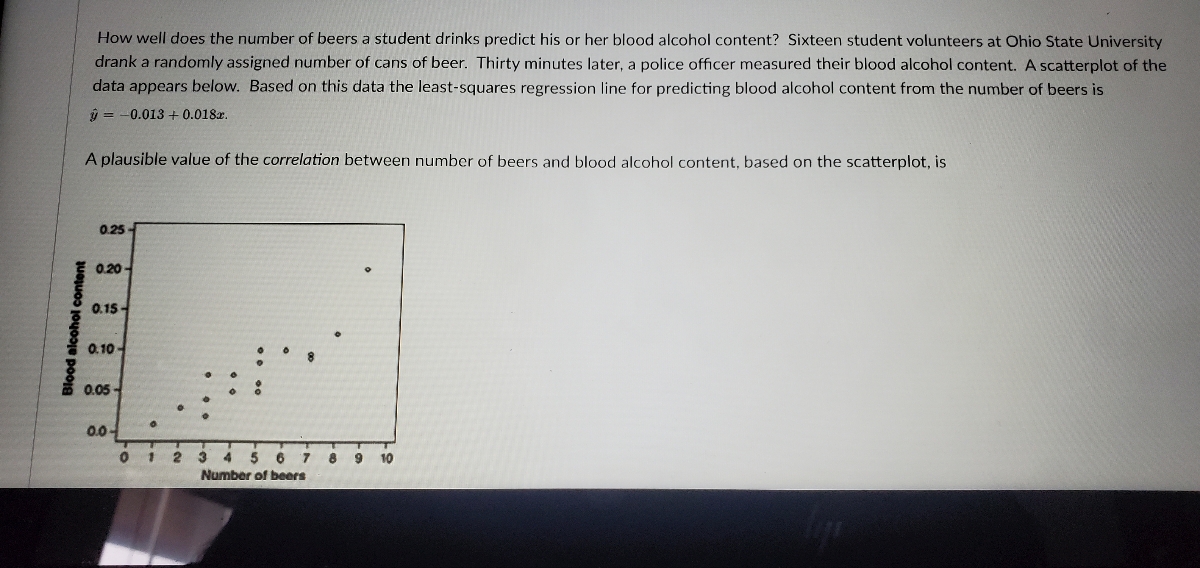

Transcribed Image Text:How well does the number of beers a student drinks predict his or her blood alcohol content? Sixteen student volunteers at Ohio State University
drank a randomly assigned number of cans of beer. Thirty minutes later, a police officer measured their blood alcohol content. A scatterplot of the
data appears below. Based on this data the least-squares regression line for predicting blood alcohol content from the number of beers is
â = 0.013 +0.018.
A plausible value of the correlation between number of beers and blood alcohol content, based on the scatterplot, is
Blood alcohol content
0.25
0.20-
0.15-
0.10-
0.05-
0.0-
0
1
2
3 4 5 67 8 9 10
Number of beers
Expert Solution
This question has been solved!
Explore an expertly crafted, step-by-step solution for a thorough understanding of key concepts.

This is a popular solution

Trending nowThis is a popular solution!

Step by stepSolved in 2 steps with 1 images

Knowledge Booster

Similar questions
- Over the past 11 days, Ivanna studied a total of 44 hours. What is the mean amount of time she studied per day? ☐ hoursarrow_forwardIt’s assumed that students need to stay awake more to study during finals week. One way to measure this is how much coffee is consumed during Finals week at night. A local coffee house near APU counted the number of cups of coffee sold per hour during Finals week after 6 p.m. We randomly select ten (10) hours of sales records during Finals week and find out that the following number of cups of coffee were consumed: 18, 17, 22, 14, 17, 20, 22, 24, 15, 15 By comparison, the sales records from a previous week were used as a comparison. The following number of cups of coffee were consumed over a seven (7) hour period: 9, 13, 5, 15, 17, 10, 11 a. Determine what is the appropriate statistical procedure, with a brief explanation (one sentence) as to why this is the appropriate procedure. b. State the null hypothesis. c. Execute the proper calculations with the appropriate procedures. d. Present a graph when appropriate of your results. e. Include any appropriate post-hoc tests. f. State…arrow_forwardHow to count z-score?arrow_forward
- please show all steps and please write out complete SENTENCES as to how you did each step. And explaining what you did to get the answer!!! Thanksarrow_forwardThe length of fish were measured at 3 different lakes. Lake 1: 3.5, 4.2, 6.1, 5.2 Lake 2: 5.1, 6.2, 5.3, 2.1 Lake 3: 5.6, 7.1, 2.4, 4.1, 6.2 Enter the test statistic (to 4 decimal places)arrow_forwardCompute the mean of 30, 70, 83, 41.arrow_forward
- The symbol σˆpσp^ represents the proportion of a sample of size n. True Falsearrow_forward6. A skateboarder descends on a ramp from 172 feet to 67 feet in 15 seconds. What is the mean change in height per second?arrow_forwardSuppose an internet marketing company wants to determine the current percentage of customers who click on ads on their smartphones. How many customers should the company survey in order to be 90% confident that the estimated proportion is within 2 percentage points of the true population proportion of customers who click on ads on their smartphones?arrow_forward
arrow_back_ios
SEE MORE QUESTIONS
arrow_forward_ios
Recommended textbooks for you
- MATLAB: An Introduction with ApplicationsStatisticsISBN:9781119256830Author:Amos GilatPublisher:John Wiley & Sons Inc
 Probability and Statistics for Engineering and th...StatisticsISBN:9781305251809Author:Jay L. DevorePublisher:Cengage Learning
 Statistics for The Behavioral Sciences (MindTap C...StatisticsISBN:9781305504912Author:Frederick J Gravetter, Larry B. WallnauPublisher:Cengage Learning
  Elementary Statistics: Picturing the World (7th E...StatisticsISBN:9780134683416Author:Ron Larson, Betsy FarberPublisher:PEARSON
 The Basic Practice of StatisticsStatisticsISBN:9781319042578Author:David S. Moore, William I. Notz, Michael A. FlignerPublisher:W. H. Freeman
 Introduction to the Practice of StatisticsStatisticsISBN:9781319013387Author:David S. Moore, George P. McCabe, Bruce A. CraigPublisher:W. H. Freeman
MATLAB: An Introduction with Applications
Statistics
ISBN:9781119256830
Author:Amos Gilat
Publisher:John Wiley & Sons Inc
Probability and Statistics for Engineering and th...
Statistics
ISBN:9781305251809
Author:Jay L. Devore
Publisher:Cengage Learning
Statistics for The Behavioral Sciences (MindTap C...
Statistics
ISBN:9781305504912
Author:Frederick J Gravetter, Larry B. Wallnau
Publisher:Cengage Learning
Elementary Statistics: Picturing the World (7th E...
Statistics
ISBN:9780134683416
Author:Ron Larson, Betsy Farber
Publisher:PEARSON
The Basic Practice of Statistics
Statistics
ISBN:9781319042578
Author:David S. Moore, William I. Notz, Michael A. Fligner
Publisher:W. H. Freeman
Introduction to the Practice of Statistics
Statistics
ISBN:9781319013387
Author:David S. Moore, George P. McCabe, Bruce A. Craig
Publisher:W. H. Freeman