
MATLAB: An Introduction with Applications
6th Edition
ISBN: 9781119256830
Author: Amos Gilat
Publisher: John Wiley & Sons Inc
expand_more
expand_more
format_list_bulleted
Related questions
Question
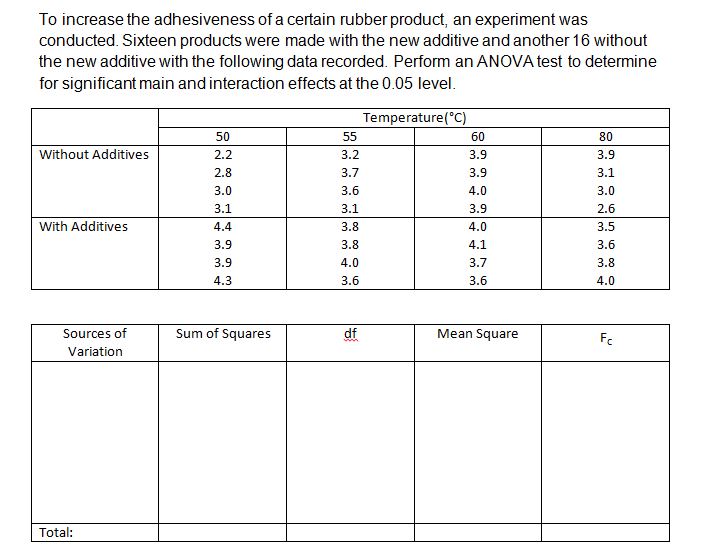

Transcribed Image Text:To increase the adhesiveness of a certain rubber product, an experiment was
conducted. Sixteen products were made with the new additive and another 16 without
the new additive with the following data recorded. Perform an ANOVA test to determine
for significant main and interaction effects at the 0.05 level.
Temperature(°C)
50
55
60
80
Without Additives
2.2
3.2
3.9
3.9
2.8
3.7
3.9
3.1
3.0
3.6
4.0
3.0
3.1
3.1
3.9
2.6
With Additives
4.4
3.8
4.0
3.5
3.9
3.8
4.1
3.6
3.9
4.0
3.7
3.8
4.3
3.6
3.6
4.0
Sources of
Sum of Squares
df
Mean Square
Fc
Variation
Total:
Expert Solution
This question has been solved!
Explore an expertly crafted, step-by-step solution for a thorough understanding of key concepts.

This is a popular solution

Trending nowThis is a popular solution!

Step by stepSolved in 5 steps with 1 images

Knowledge Booster

Similar questions
- Inorganic phosphorous is a naturally occurring element in all plants and animals, with concentrations increasing progressively up the food chain (fruit < vegetables < cereals < nuts < corpse). Geochemical surveys take soil samples to determine phosphorous content (in ppm, parts per million). A high phosphorous content may or may not indicate an ancient burial site, food storage site, or even a garbage dump. Independent random samples from two regions gave the following phosphorous measurements (in ppm). Assume the distribution of phosphorous is mound-shaped and symmetric for these two regions. Region I: x,; n, = 15 875 1,080 2,330 1,850 1,860 853 1,551 1,230 2,340 1,080 910 1,130 1,450 1,260 1,010 Region II: x,; n, = 14 540 808 790 1,230 1,770 960 1,650 860 890 640 1,180 1,160 1,050 | 1,020 In USE SALT (a) Use a calculator with mean and standard deviation keys to verify that x,, S,, x2, and s,. (Round your answers to four decimal places.) X1 ppm S. = ppm X2 ppm 52 ppm (b) Let u, be the…arrow_forwardAnswer the whole quesrionarrow_forwardAssume that ρxy = .30 between weight and exercise for the population of normal adults. However, a researcher believes the relationship is stronger for children. The researcher tests a sample of 28 children and obtains an rxy = .47. Does this result support the researcher’s belief? Conduct an appropriate statistical test using an alpha level of .05.arrow_forward
- The Board of Transportation and Safety (BTS) wants to examine the safety mechanisms of A, B, and C-class cars. Samples of 10 cars for each class were used. The board members collect the pressure exerted overall on the driver’s body during an impact test. Assume alpha of 0.05. What is dfbetween = ? What is dfwithin = ? What is the critical test statistic: ? A B C 27 21 48 13 23 39 11 10 22 15 27 30 34 34 31 n(A) = 5 n(B) = 5 n(B) = 5 T(A)=100 T(B)=115 T(C)=170 SS(A)=86 SS(B)=135 SS(C)=151 What is the MSbetween=? What is the MSwithin=? What is the calculated test statistic? Given the values of your critical test statistic and calculated test statistic, do you reject the null?arrow_forwardThirty different video games showing drug use were observed. The duration times of drug use (in seconds) were recorded. When using this sample for a t test of the claim that the population mean is greater than 92 sec, what does df denote, and what is its value? what's the value of df?arrow_forward1.2 According to the journal Chemical Engineering, an important property of a fiber is its water ab- sorbency. A random sample of 20 pieces of cotton fiber was taken and the absorbency on each piece was mea- sured. The following are the absorbency values: 18.71 21.41 20.72 21.81 19.29 22.43 20.17 23.71 19.44 20.50 18.92 20.33 23.00 22.85 19.25 21.77 22.11 19.77 18.04 21.12 (a) Calculate the sample mean and median for the above sample values.arrow_forward
arrow_back_ios
arrow_forward_ios
Recommended textbooks for you
- MATLAB: An Introduction with ApplicationsStatisticsISBN:9781119256830Author:Amos GilatPublisher:John Wiley & Sons Inc
 Probability and Statistics for Engineering and th...StatisticsISBN:9781305251809Author:Jay L. DevorePublisher:Cengage Learning
 Statistics for The Behavioral Sciences (MindTap C...StatisticsISBN:9781305504912Author:Frederick J Gravetter, Larry B. WallnauPublisher:Cengage Learning
  Elementary Statistics: Picturing the World (7th E...StatisticsISBN:9780134683416Author:Ron Larson, Betsy FarberPublisher:PEARSON
 The Basic Practice of StatisticsStatisticsISBN:9781319042578Author:David S. Moore, William I. Notz, Michael A. FlignerPublisher:W. H. Freeman
 Introduction to the Practice of StatisticsStatisticsISBN:9781319013387Author:David S. Moore, George P. McCabe, Bruce A. CraigPublisher:W. H. Freeman
MATLAB: An Introduction with Applications
Statistics
ISBN:9781119256830
Author:Amos Gilat
Publisher:John Wiley & Sons Inc
Probability and Statistics for Engineering and th...
Statistics
ISBN:9781305251809
Author:Jay L. Devore
Publisher:Cengage Learning
Statistics for The Behavioral Sciences (MindTap C...
Statistics
ISBN:9781305504912
Author:Frederick J Gravetter, Larry B. Wallnau
Publisher:Cengage Learning
Elementary Statistics: Picturing the World (7th E...
Statistics
ISBN:9780134683416
Author:Ron Larson, Betsy Farber
Publisher:PEARSON
The Basic Practice of Statistics
Statistics
ISBN:9781319042578
Author:David S. Moore, William I. Notz, Michael A. Fligner
Publisher:W. H. Freeman
Introduction to the Practice of Statistics
Statistics
ISBN:9781319013387
Author:David S. Moore, George P. McCabe, Bruce A. Craig
Publisher:W. H. Freeman