
MATLAB: An Introduction with Applications
6th Edition
ISBN: 9781119256830
Author: Amos Gilat
Publisher: John Wiley & Sons Inc
expand_more
expand_more
format_list_bulleted
Related questions
Question
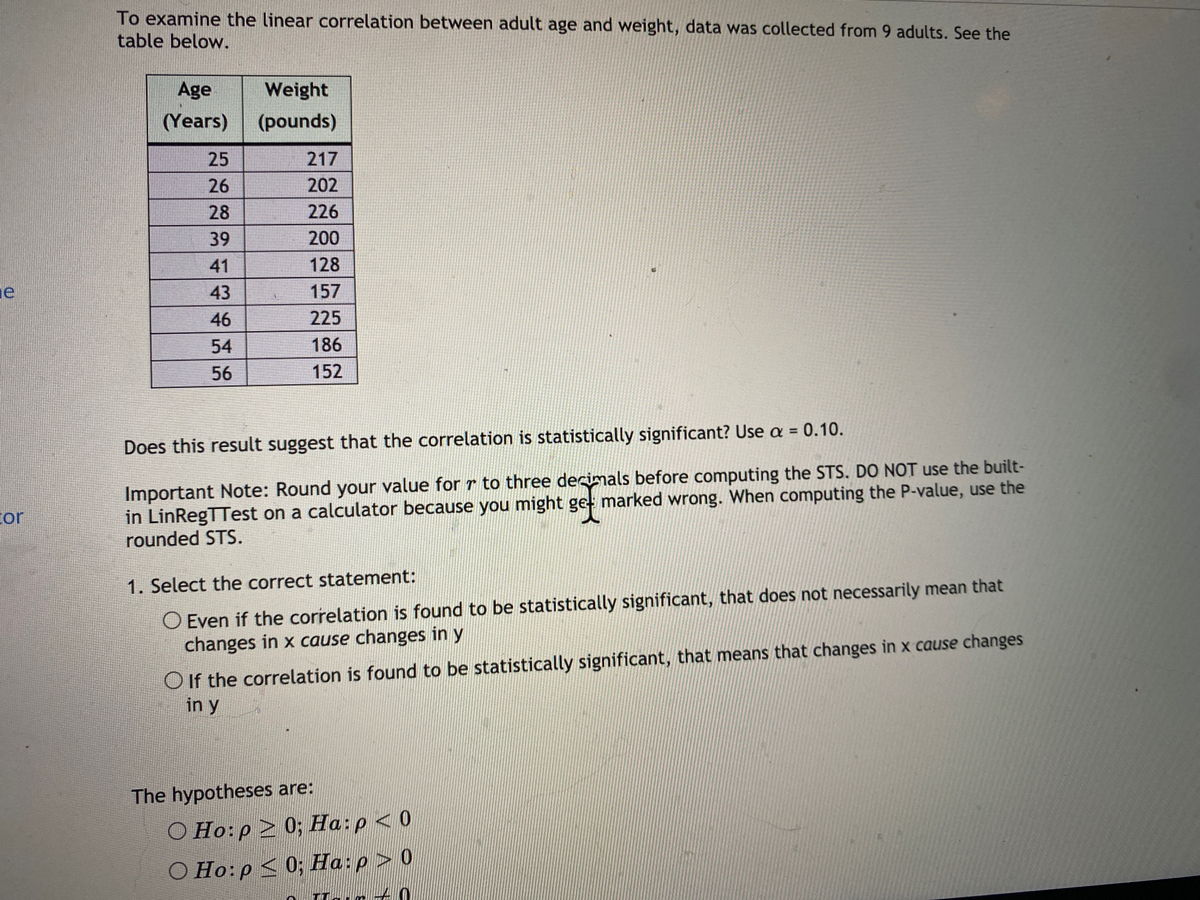

Transcribed Image Text:To examine the linear correlation between adult age and weight, data was collected from 9 adults. See the
table below.
Age
Weight
(Years)
(pounds)
25
217
26
202
28
226
39
200
41
128
43
157
46
225
54
186
56
152
Does this result suggest that the correlation is statistically significant? Use a = 0.10.
Important Note: Round your value for r to three decimals before computing the STS. DO NOT use the built-
in LinRegTTest on a calculator because you might get marked wrong. When computing the P-value, use the
rounded STS.
cor
O Even if the correlation is found to be statistically significant, that does not necessarily mean that
changes in x cause changes iny
1. Select the correct statement:
O If the correlation is found to be statistically significant, that means that changes in x cause changes
in y
The hypotheses are:
O Ho:p > 0; Ha:p <0
O Ho:p < 0; Ha:p > 0
ILar + 0

Transcribed Image Text:O Ho:p < 0; Ha:p > 0
O Ho:r = 0; Ha:r # 0
O Ho:r > 0; Ha:r < 0
O Ho:r < 0; Ha:r > 0
O Ho:p = 0; Ha:p + 0
2. This is a C rightO leftO two tailed test and the distribution used is
OZ
OT
The Degrees of Freedom are
07
ON/A; this is a Z-test
08
9.
3. The STS (round to 3 decimals) is:
The P-value (round to 4 decimals) is:
Expert Solution
This question has been solved!
Explore an expertly crafted, step-by-step solution for a thorough understanding of key concepts.

Step by stepSolved in 2 steps with 1 images

Knowledge Booster


Learn more about
Need a deep-dive on the concept behind this application? Look no further. Learn more about this topic, statistics and related others by exploring similar questions and additional content below.Similar questions
- Data was collected for a sample of organic snacks. The amount of sugar (in mg) in each snack is summarized in the histogram below. Frequency 10 8 6 4 2 100 101 102 103 104 105 106 10 amount of sugar (mg) What is the frequency of 102 mg of sugar? snacksarrow_forwardPlease answer all thoroughly and clearly Grade 12 Data Managementarrow_forwardWhat type of data would you use for collecting data on lap swim time?arrow_forward
- QUESTION 3 What percent of scores are below an SAT score of 560?arrow_forwardThe table available below shows the weights (in pounds) for a sample of vacuum cleaners. The weights are classified according to vacuum cleaner type. At a = 0.10, can you conclude that at least one mean vacuum cleaner weight is different from the others? Click the icon to view the vacuum cleaner weight data. Let μBU, BLU, and μTC represent the mean weights for bagged upright, bagless upright, and top canister vacuums respectively. What are the hypotheses for this test? A. Ho: At least one of the means is different. Ha: MBUHBLUPTC B. Ho: "BU HBLU HTC # Ha: MBUHBLUPTC C. Ho: MBUHBLU = HTC Ha: At least one of the means is different. D. Ho: MBU - HBLU = μTC Ha: HBU #BLU HTC What is the test statistic? F = 12.56 (Round to two decimal places as needed.) What is the P-value? P-value = 0.000624 (Round to three decimal places as needed.)arrow_forwardUsing PivotTables, find the mean and standard deviation of sales by region in the data provided. LOADING... Click the icon to view the data. Question content area bottom Part 1 Complete the table below. (Type integers or decimals rounded to two decimal places as needed.) Average of Amount StdDev of Amount East enter your response here enter your response here North enter your response here enter your response here South enter your response here enter your response here West enter your response here enter your response here Grand Total enter your response here enter your response herearrow_forward
- QUESTION 7 Given an x-mean3D3.4, SSx-97.3, y-mean33.9, SSy-45.2, Sxy-55.5, and a sample size of 45, calculate the following: X Sample Standard Deviation and Y Sample Standard Deviation X Population Standard Deviation and Y Population Standard Deviation Sample Covariance and Population Covariance Sample Correlation and Population Correlationarrow_forwardEstimate the most likely degree of correlation for the scatterplot Options: a. 0 b. .85 c. -.90 d. -.05arrow_forwardThe authors of a paper were interested in how the distance a deer mouse will travel for food is related to the distance from the food to the nearest pile of debris. Distances were measured in meters. The data and computer output are given below. Distance from Debris Distance Traveled 6.94 0.00 5.23 6.13 5.21 11.29 7.10 14.35 8.16 12.03 5.50 22.72 9.19 20.11 9.05 26.16 9.36 30.65 Simple Linear Regression Results: Dependent Variable: Traveled Independent Variable: Debris Sample size: 9 R (correlation coefficient) = 0.5657 R-sq = 0.32002088 Estimate of error standard deviation 8.670711 Parameter estimates: Parameter Estimate Std. Err. Alternative DF T-Stat P-Value Intercept -7.6854587 13.332196 ≠ 0 7 -0.5764586 0.5824 Slope 3.2340908 1.7818117 ≠ 0 7 1.8150575 0.1124 a)What is the least squares regression line for the output given above? b) what is the predicted traveled distance given the distance from debris is 6.5 meters?arrow_forward
- d and f only do not understand how to calculate Where are the deer? Random samples of square-kilometer plots were taken in different ecological locations of a national park. The deer counts per square kilometer were recorded and are shown in the following table. Mountain Brush Sagebrush Grassland Pinon Juniper 35 17 2 30 53 6 20 19 2 26 19 8 Shall we reject or accept the claim that there is no difference in the mean number of deer per square kilometer in these different ecological locations? Use a 5% level of significance. (a) What is the level of significance? State the null and alternate hypotheses. Ho: μ1 = μ2 = μ3; H1: All three means are different.Ho: μ1 = μ2 = μ3; H1: Exactly two means are equal. Ho: μ1 = μ2 = μ3; H1: Not all the means are equal.Ho: μ1 = μ2 = μ3; H1: At least two means are equal. (b) Find SSTOT, SSBET, and SSW and check that SSTOT = SSBET + SSW. (Use 3 decimal places.) SSTOT = SSBET = SSW = Find d.f.BET, d.f.W, MSBET,…arrow_forwardGiven the scatter plot below, which of the following describes the strength and direction of the data? 10 Weak negative correlation Strong negative correlation Strong positive correlation Weak positive correlationarrow_forwardQUESTION 2 What percent of scores are above an ACT score of 19?arrow_forward
arrow_back_ios
SEE MORE QUESTIONS
arrow_forward_ios
Recommended textbooks for you
- MATLAB: An Introduction with ApplicationsStatisticsISBN:9781119256830Author:Amos GilatPublisher:John Wiley & Sons Inc
 Probability and Statistics for Engineering and th...StatisticsISBN:9781305251809Author:Jay L. DevorePublisher:Cengage Learning
 Statistics for The Behavioral Sciences (MindTap C...StatisticsISBN:9781305504912Author:Frederick J Gravetter, Larry B. WallnauPublisher:Cengage Learning
  Elementary Statistics: Picturing the World (7th E...StatisticsISBN:9780134683416Author:Ron Larson, Betsy FarberPublisher:PEARSON
 The Basic Practice of StatisticsStatisticsISBN:9781319042578Author:David S. Moore, William I. Notz, Michael A. FlignerPublisher:W. H. Freeman
 Introduction to the Practice of StatisticsStatisticsISBN:9781319013387Author:David S. Moore, George P. McCabe, Bruce A. CraigPublisher:W. H. Freeman
MATLAB: An Introduction with Applications
Statistics
ISBN:9781119256830
Author:Amos Gilat
Publisher:John Wiley & Sons Inc
Probability and Statistics for Engineering and th...
Statistics
ISBN:9781305251809
Author:Jay L. Devore
Publisher:Cengage Learning
Statistics for The Behavioral Sciences (MindTap C...
Statistics
ISBN:9781305504912
Author:Frederick J Gravetter, Larry B. Wallnau
Publisher:Cengage Learning
Elementary Statistics: Picturing the World (7th E...
Statistics
ISBN:9780134683416
Author:Ron Larson, Betsy Farber
Publisher:PEARSON
The Basic Practice of Statistics
Statistics
ISBN:9781319042578
Author:David S. Moore, William I. Notz, Michael A. Fligner
Publisher:W. H. Freeman
Introduction to the Practice of Statistics
Statistics
ISBN:9781319013387
Author:David S. Moore, George P. McCabe, Bruce A. Craig
Publisher:W. H. Freeman