MATLAB: An Introduction with Applications
6th Edition
ISBN: 9781119256830
Author: Amos Gilat
Publisher: John Wiley & Sons Inc
expand_more
expand_more
format_list_bulleted
Concept explainers
Question

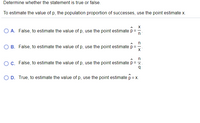
Transcribed Image Text:Determine whether the statement is true or false.
To estimate the value of p, the population proportion of successes, use the point estimate x.
O A. False, to estimate the value of p, use the point estimate p=
B. False, to estimate the value of p, use the point estimate p
in
OC. False, to estimate the value of p, use the point estimate p=.
O D. True, to estimate the value of p, use the point estimate p = x.
Expert Solution
This question has been solved!
Explore an expertly crafted, step-by-step solution for a thorough understanding of key concepts.
This is a popular solution
Trending nowThis is a popular solution!
Step by stepSolved in 2 steps

Knowledge Booster
Learn more about
Need a deep-dive on the concept behind this application? Look no further. Learn more about this topic, statistics and related others by exploring similar questions and additional content below.Similar questions
- Determine whether the statement is true or false. If it is false, rewrite it as a true statement. As the size of a sample increases, the mean of the distribution of sample means increases. Choose the correct answer below. O A. False. As the size of a sample increases, the mean of the distribution of sample means decreases. B. False. As the size of a sample increases, the mean of the distribution of sample means does not change. O C. True.arrow_forwardCan someone please help? Thank you.arrow_forwardBelow are the heights (in inches) of a sample of football players. Graph the boxplot and find the values for each of the quartiles and outlier(s), if they exist. (10 points for total) Students use the data below to calculate: 85 83 79 55 70 775 89 76 28. Smallest value= Q1= Q2= Q3= Largest value= 87 88 88 85 86 Outlier(s) Draw the Boxplot inside the box and label all values:arrow_forward
- Use the t-table or any statistical tool and report the t-score that you multiple by the standard error to form the margin of error for a 95% confidence interval for a mean with 5 observations. a. 2.132 b. 2.776 c. 2.015 d. 2.571arrow_forwardIs parameter proportion the same as statistical proportion. so lets say the statistical proportion is 0.49. Would the parameter proportion be 0.49 as well ?arrow_forwardWhen a researcher changes their data analyses to get the p-value they desire, that is known as a. HARKing b. p-hacking c. multiple comparisons d. a Type II errorarrow_forward
- K The accompanying data represent the wait time (in minutes) for a random sample of 40 visitors to a popular attraction in a large amusement park. Use the sample data to complete parts (a) through (d). Click the icon to view the data for wait times. Wait times 7 6454256200 15 32 23 8 . 9 44 10 9 33 55 1 27 6 9 6 Print 22 7 23 10 25 25 16 54 3 9 32 Done *** 0 3 6 12 5 3 7 8 13 7 16 C - Xarrow_forward1.) Write your solution A. Determine the 1" quartile, 2 quartile, 3rd quartile and interquartile range (IQR), given the scores of; 11, 24, 23, 11, 13, 17, 15, 19, 21, then interpret each of your answer. B. Solve for the Percentile Rank of 17.arrow_forwardUse the sample data and confidence level given below to complete parts (a) through (d). A research institute poll asked respondents if they felt vulnerable to identity theft. In the poll, n = 1005 and x = 580 who said "yes." Use a 95% confidence level. Click the icon to view a table of z scores. a) Find the best point estimate of the population proportion p. (Round to three decimal places as needed.) ew an example Get more help. MacBook Air ... Clear all Chec.arrow_forward
arrow_back_ios
arrow_forward_ios
Recommended textbooks for you
 MATLAB: An Introduction with ApplicationsStatisticsISBN:9781119256830Author:Amos GilatPublisher:John Wiley & Sons Inc
 Probability and Statistics for Engineering and th...StatisticsISBN:9781305251809Author:Jay L. DevorePublisher:Cengage Learning
 Statistics for The Behavioral Sciences (MindTap C...StatisticsISBN:9781305504912Author:Frederick J Gravetter, Larry B. WallnauPublisher:Cengage Learning
 Elementary Statistics: Picturing the World (7th E...StatisticsISBN:9780134683416Author:Ron Larson, Betsy FarberPublisher:PEARSON
 The Basic Practice of StatisticsStatisticsISBN:9781319042578Author:David S. Moore, William I. Notz, Michael A. FlignerPublisher:W. H. Freeman
 Introduction to the Practice of StatisticsStatisticsISBN:9781319013387Author:David S. Moore, George P. McCabe, Bruce A. CraigPublisher:W. H. Freeman

MATLAB: An Introduction with Applications
Statistics
ISBN:9781119256830
Author:Amos Gilat
Publisher:John Wiley & Sons Inc

Probability and Statistics for Engineering and th...
Statistics
ISBN:9781305251809
Author:Jay L. Devore
Publisher:Cengage Learning

Statistics for The Behavioral Sciences (MindTap C...
Statistics
ISBN:9781305504912
Author:Frederick J Gravetter, Larry B. Wallnau
Publisher:Cengage Learning

Elementary Statistics: Picturing the World (7th E...
Statistics
ISBN:9780134683416
Author:Ron Larson, Betsy Farber
Publisher:PEARSON

The Basic Practice of Statistics
Statistics
ISBN:9781319042578
Author:David S. Moore, William I. Notz, Michael A. Fligner
Publisher:W. H. Freeman

Introduction to the Practice of Statistics
Statistics
ISBN:9781319013387
Author:David S. Moore, George P. McCabe, Bruce A. Craig
Publisher:W. H. Freeman