
MATLAB: An Introduction with Applications
6th Edition
ISBN: 9781119256830
Author: Amos Gilat
Publisher: John Wiley & Sons Inc
expand_more
expand_more
format_list_bulleted
Related questions
Question
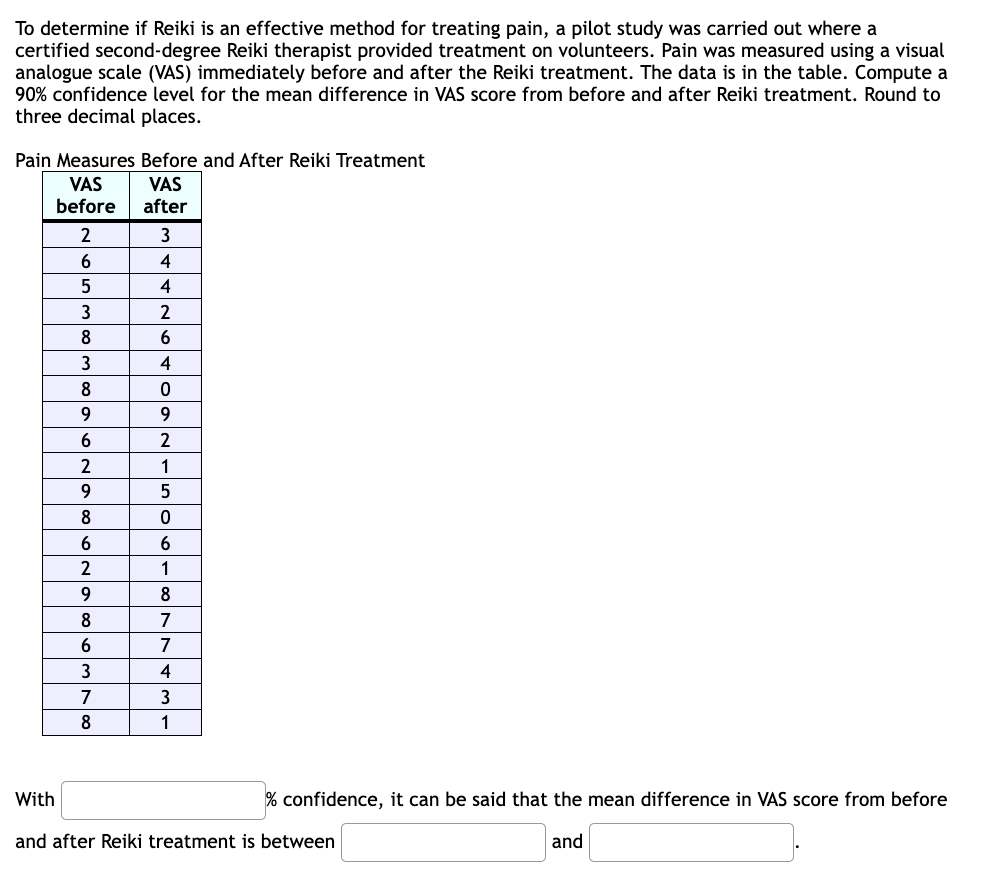

Transcribed Image Text:To determine if Reiki is an effective method for treating pain, a pilot study was carried out where a
certified second-degree Reiki therapist provided treatment on volunteers. Pain was measured using a visual
analogue scale (VAS) immediately before and after the Reiki treatment. The data is in the table. Compute a
90% confidence level for the mean difference in VAS score from before and after Reiki treatment. Round to
three decimal places.
Pain Measures Before and After Reiki Treatment
VAS
after
VAS
before
2
6
5
3
8
3
8
9
6
2
9
8
6
2
9
8
6
3
7
8
3
4
4
2
6
4
CANIFO
0
9
2
1
5
0
6
1
8
7
7
4
3
1
With
and after Reiki treatment is between
% confidence, it can be said that the mean difference in VAS score from before
and
Expert Solution
This question has been solved!
Explore an expertly crafted, step-by-step solution for a thorough understanding of key concepts.

This is a popular solution

Trending nowThis is a popular solution!

Step by stepSolved in 2 steps with 3 images

Knowledge Booster

Similar questions
- Describe when you would use a t-score instead of a z-score when finding a confidence interval.arrow_forwardTreating the 2015 Tobacco rate data as a sample, construct a 95% confidence interval for the mean tobacco rate for males and for females. Interpret each interval. Does it appear that males use tobacco at a higher rate than females? Justify your answer, using the confidence intervals in your explanation. Construct the same confidence interval for males at the 99% confidence level. Compare to the male 95% confidence interval from the previous question. What happened to the interval when the confidence level increased? Explain why. Prevalence of smoking any tobacco product among persons aged >= 15 years Male 2015 Prevalence of smoking any tobacco product among persons aged >= 15 years Female 2015 51.2 7.6 37.2 27.8 29.5 18.4 52.3 1.5 16.7 13.1 35.5 34.8 46.5 0.4 48.8 7.6 39.8 0.7 13.1 0.9 46.2 10.6 26.5 20 17.7 1 30.5 17.1 47.2 30 19.3 11.3 29.3 3.1 42.4 28.2 36 4.5 22.2 3.5 44.1 2.8…arrow_forwardPlease help!arrow_forward
- construct a confidence interval for this data. You should construct a 95% confidence interval for this data. How you do this will depend on whether your data is summarized using a mean or proportions. If you have categorical data, you will have to pick one of the categories and focus on a confidence interval for the proportion for that category, and you only need to do one for that one category. Please show the parts of your equation (point estimate, Z or T, and standard error) in addition to your final result.arrow_forwardA graduate student is interested in how viewing different types of scenes affects working memory. For his study, he selects a random sample of 36 adults. The subjects complete a series of working memory tests before and after walking in an urban setting. Before the walk, the mean score on the test of working memory was 9.1. After the walk, the mean score was 1.4 higher. The graduate student has no presupposed assumptions about how viewing different types of scenes affects working memory, so he formulates the null and alternative hypotheses as: H00 : μDD = 0 H11 : μDD ≠ 0 Assume that the data satisfy all of the required assumptions for a repeated-measures t test. The graduate student calculates the following statistics for his hypothesis test: Mean difference (MDD) 1.4 Estimated population standard deviation of the differences (s) 1.6 Estimated standard error of the mean differences (sMDMD) 0.2667 Degrees of freedom (df) 35 The t statistic 5.25 The critical values of t…arrow_forwardData are used either to test a hypothesis or to construct a confidence interval, but not both. Explain.arrow_forward
- A learn-to-type software program claims that it can improve your typing skills. To test the claim and possibly help yourself out, you and six of your friends decide to try the program and see what happens. Use the table below to construct an 80% confidence interval for the true mean change in the typing speeds for people who have completed the typing program. Let Population 1 be the typing speed before taking the program and Population 2 be the typing speed after taking the program. Round the endpoints of the interval to one decimal place, if necessary. Typing Speeds (in Words per Minute) Before After 32 33 51 42 55 40 35 32 54 33 45 30 50 52arrow_forwardMatch to the appropriate answer. You will not use all options and you may not use each option more than once. Dummy variable Coefficient (beta) Correlation coefficient Heteroscedasticity p-value R² + Residual A. Used with categorical variable B. Lower value means statistical significance at a higher confidence level. C. When the distribution of residuals does change as the independent variable changes. D. Higher value means statistical significance at a higher confidence level. E. Difference between the predicted and observed values. F. When the distribution of residuals does not change as the independent variable changes. G. Min=-1, Max=1 H. Min-0, Max=1 1. Used to determine how much dependent variables changes if independent variable changed.arrow_forwarda critic points out that this 95 % confidence interval is only accurate if the statistic follows a normal distrubution , or if the normal model is a good approximation. is this true for this data? explainarrow_forward
arrow_back_ios
arrow_forward_ios
Recommended textbooks for you
- MATLAB: An Introduction with ApplicationsStatisticsISBN:9781119256830Author:Amos GilatPublisher:John Wiley & Sons Inc
 Probability and Statistics for Engineering and th...StatisticsISBN:9781305251809Author:Jay L. DevorePublisher:Cengage Learning
 Statistics for The Behavioral Sciences (MindTap C...StatisticsISBN:9781305504912Author:Frederick J Gravetter, Larry B. WallnauPublisher:Cengage Learning
  Elementary Statistics: Picturing the World (7th E...StatisticsISBN:9780134683416Author:Ron Larson, Betsy FarberPublisher:PEARSON
 The Basic Practice of StatisticsStatisticsISBN:9781319042578Author:David S. Moore, William I. Notz, Michael A. FlignerPublisher:W. H. Freeman
 Introduction to the Practice of StatisticsStatisticsISBN:9781319013387Author:David S. Moore, George P. McCabe, Bruce A. CraigPublisher:W. H. Freeman
MATLAB: An Introduction with Applications
Statistics
ISBN:9781119256830
Author:Amos Gilat
Publisher:John Wiley & Sons Inc
Probability and Statistics for Engineering and th...
Statistics
ISBN:9781305251809
Author:Jay L. Devore
Publisher:Cengage Learning
Statistics for The Behavioral Sciences (MindTap C...
Statistics
ISBN:9781305504912
Author:Frederick J Gravetter, Larry B. Wallnau
Publisher:Cengage Learning
Elementary Statistics: Picturing the World (7th E...
Statistics
ISBN:9780134683416
Author:Ron Larson, Betsy Farber
Publisher:PEARSON
The Basic Practice of Statistics
Statistics
ISBN:9781319042578
Author:David S. Moore, William I. Notz, Michael A. Fligner
Publisher:W. H. Freeman
Introduction to the Practice of Statistics
Statistics
ISBN:9781319013387
Author:David S. Moore, George P. McCabe, Bruce A. Craig
Publisher:W. H. Freeman