Concept explainers
| To calculate |
Standard normal distribution:
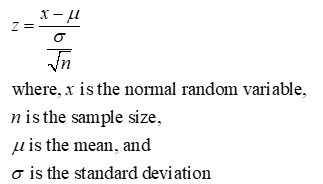
The standard normal distribution is a special case of normal distribution, in which the mean of the distribution is 0 and standard deviation of the distribution is 1. The Z-scores for the given sample size can be calculated using the given formula.

The procedure for obtaining the percentage of all the possible observations that lie within the specified range is as follows:
- Sketch the normal curve associated with the variable.
- Shade the region of interest and mark the delimiting x-values.
- Compute the z-scores for the x-
- Find the area under the standard normal curve for the computed z-scores using standard normal table.
Several tests of normality exist, using which you can verify whether a particular data follows the normal distribution.
Usually, before conducting a formal test, we prefer to take the help of graphical methods, to see if the data may be assumed to follow the normal distribution, at least approximately. A few such graphical methods are:
- Histogram of the data , superimposed with a normal probability curve,
- Normal probability plot with confidence interval,
- Normal quantile-quantile (QQ) plot.
- Boxplot, etc.
Step by stepSolved in 3 steps with 1 images

- Two normal distributions have exactly the same mean, but one has a standard deviation of 20 and the other has a standard deviation of 10. How would the shapes of the two distributions compare ?arrow_forwardTwo χ2-curves have degrees of freedom 12 and 20, respectively. Which curve more closely resembles a normal curve? Explain your answer.arrow_forwardDefine average parameter.arrow_forward
- PLEASE i need serious help with number 2&3 please help with both write the answer clear and easy to understand pleasearrow_forwardWhen do we use a mean and SD to define a continuous variable distribution?arrow_forwardfor a standard normal distribution, find the percentage of data that are between 3 standard deviations below the mean and 1 standard deviation above the meanarrow_forward
- Explain kurtosis of the distribution?arrow_forwardThe following figure is a normal curve that represents the approximate weights, in pounds, of adult female cats of a certain breed Area = 0.3433 Area = 0.0701 8.5 11.0 Part 1 of 3 (a) Find the proportion of cats who weigh more than 8.5 pounds. The proportion of cats who weigh more than 8.5 pounds is 0.6567 Part: 1/ 3 Part 2 of 3 (b) Find the proportion of cats who weigh less than 11.0 pounds. The proportion of cats who weigh less than 11.0 pounds isarrow_forwardCalculate power using the normal distribution?arrow_forward
- what is the standard normal curve that lies between "-2.16" and 2.16arrow_forward1. Describe the key features of the normal curve and explain why the normal curve in real-life distributions nevermatches the model perfectly.arrow_forward4. Explain why t distributions tend to be flatter and more spread out than the normal distribution.arrow_forward
 MATLAB: An Introduction with ApplicationsStatisticsISBN:9781119256830Author:Amos GilatPublisher:John Wiley & Sons Inc
 Probability and Statistics for Engineering and th...StatisticsISBN:9781305251809Author:Jay L. DevorePublisher:Cengage Learning
 Statistics for The Behavioral Sciences (MindTap C...StatisticsISBN:9781305504912Author:Frederick J Gravetter, Larry B. WallnauPublisher:Cengage Learning
 Elementary Statistics: Picturing the World (7th E...StatisticsISBN:9780134683416Author:Ron Larson, Betsy FarberPublisher:PEARSON
 The Basic Practice of StatisticsStatisticsISBN:9781319042578Author:David S. Moore, William I. Notz, Michael A. FlignerPublisher:W. H. Freeman
 Introduction to the Practice of StatisticsStatisticsISBN:9781319013387Author:David S. Moore, George P. McCabe, Bruce A. CraigPublisher:W. H. Freeman


