Chemistry
10th Edition
ISBN: 9781305957404
Author: Steven S. Zumdahl, Susan A. Zumdahl, Donald J. DeCoste
Publisher: Cengage Learning
expand_more
expand_more
format_list_bulleted
Concept explainers
Question
Same answer choices for all questions

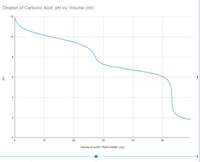
Transcribed Image Text:## Titration of Carbonic Acid: pH vs. Volume
### Graph Description
This graph illustrates the titration curve of carbonic acid, depicting the relationship between pH and the volume of acidic titrant added, measured in milliliters (mL).
- **X-Axis**: Represents the Volume of Acidic Titrant Added (mL). The scale ranges from 0 to approximately 55 mL.
- **Y-Axis**: Represents the pH level of the solution, with a range from 0 to 12.
### Curve Analysis
- **Initial pH**: The graph begins with a high pH value close to 12, indicating a basic solution.
- **Buffer Region**: As titrant is added, the pH gradually decreases. The curve shows a relatively steady decline until around 20 mL, where it starts to drop more sharply.
- **First Equivalence Point**: The graph displays a noticeable inflection point around 25 mL, where the pH drops more significantly. This is the first equivalence point, indicating the major reaction of carbonic acid.
- **Second Equivalence Point**: A second inflection occurs around 50 mL, signifying the second equivalence point, typical for the diprotic nature of carbonic acid.
### Conclusion
This titration curve is typical for diprotic acids like carbonic acid, where two distinct equivalence points are observed due to the sequential deprotonation reactions. The initial higher pH and subsequent steep declines indicate the neutralization process as more titrant is added, highlighting the buffering capacity and acid dissociation characteristics of carbonic acid.

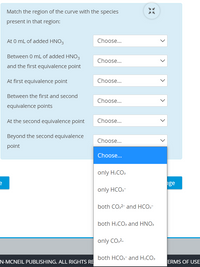
Transcribed Image Text:**Interactive Exercise: Identifying Species in Titration Curve Regions**
**Instructions**: Match the region of the curve with the chemical species present in that region during a titration process. Use the dropdown menus to select your answer for each scenario.
1. **At 0 mL of added HNO₃**
- Options:
- only H₂CO₃
- only HCO₃⁻
- both CO₃²⁻ and HCO₃⁻
- both H₂CO₃ and HNO₃
- only CO₃²⁻
- both HCO₃⁻ and H₂CO₃
2. **Between 0 mL of added HNO₃ and the first equivalence point**
- Options:
- only H₂CO₃
- only HCO₃⁻
- both CO₃²⁻ and HCO₃⁻
- both H₂CO₃ and HNO₃
- only CO₃²⁻
- both HCO₃⁻ and H₂CO₃
3. **At first equivalence point**
- Options:
- only H₂CO₃
- only HCO₃⁻
- both CO₃²⁻ and HCO₃⁻
- both H₂CO₃ and HNO₃
- only CO₃²⁻
- both HCO₃⁻ and H₂CO₃
4. **Between the first and second equivalence points**
- Options:
- only H₂CO₃
- only HCO₃⁻
- both CO₃²⁻ and HCO₃⁻
- both H₂CO₃ and HNO₃
- only CO₃²⁻
- both HCO₃⁻ and H₂CO₃
5. **At the second equivalence point**
- Options:
- only H₂CO₃
- only HCO₃⁻
- both CO₃²⁻ and HCO₃⁻
- both H₂CO₃ and HNO₃
- only CO
Expert Solution
This question has been solved!
Explore an expertly crafted, step-by-step solution for a thorough understanding of key concepts.
This is a popular solution
Trending nowThis is a popular solution!
Step by stepSolved in 6 steps

Knowledge Booster
Learn more about
Need a deep-dive on the concept behind this application? Look no further. Learn more about this topic, chemistry and related others by exploring similar questions and additional content below.Similar questions
- Assuming that an experiment's results are 10.1, 10.4 and 10.6, find the mean, the average deviation from the mean and the standard deviation. You can use Excel to verify your calculation. Use the editor to format your answerarrow_forwardFor the data set, calculate the mean, standard deviation, and variance. mean: \table[[Sample, Value ],[1,4.028], [2,4.011], [3, 4.013], [4, 4.029], [5, 4.017], [6, 4.012]] standard deviation: variance: Ⓒ Macmillan Learning mean: For the data set, calculate the mean, standard deviation, and variance. standard deviation: 3 variance: C Sample 1 2 3 4 5 6 Value 4.028 4.011 4.013 4.029 4.017 4.012arrow_forwardPerform the calculation and record the answer with the correct number of significant figures. (34.123 +4.20) (98.76546.639) F4 Z $ F5 010 % = A F6 F7 & F8 F9 Ale A- F10 !!! A+ F11 Pause ] F12 Scr Lk PrtSc SysRq +arrow_forward
- = 8 E 10 An electric current of 463.0 mA flows for 43.0 minutes. Calculate the amount of electric charge transported. Be sure your answer has the correct unit symbol and the correct number of significant digits. Continue O 2020 McGraw-Hill Education. Al I n p3.jpg Calc Fin p1jpg Type here to search 080 F2 F3 F4 F5 F6 F7 F8 F9 F10 F11 F12 Pr z' DIO Scr Lk S- %23 & 4. 6. 7 W %24arrow_forwardDraw the starting alkene that would lead to these major products under these conditions. Drawing H₂ Pd/C 11arrow_forward15:32 Sun May 2 Done < AA A session.masteringchemistry.comarrow_forwardIn a particular trial, a student got a value for R of 0.085. Calculate the percent deviation of this result. Enter a number without the % sign. The percent deviation should be reported as a positive value. (R accepted 0.082006)arrow_forwardComplete each row of the table below by filling in the missing prefix. 1 | Hz 3 10 Hz %3D 1 Hz 10 Hz -6 1 Hz 10 Hz %3D -1 1 Hz 10 Hzarrow_forwardAll changes save 7. When two solutions are mixed, a color change occurs. The data tables show the time between mixing and the color change for two sets of conditions. For Condition One, the solution concentrations were constant and temperature varied. For Condition Two, the temperature was constant and concentrations varied. Condition One: Concentration Time for Temperature (°C) Sample Color to Change 1 10° 36 sec 22° 14 sec Condition Two: Temperature Time for Concentration Sample Color to % Change 1. 100% 15 sec 2. 50% 24 sec Which of these statements is true according to the data? O The reaction rate is greater at 22°C than at 10°C. O Reducing the temperature increases the rate of the reaction. The reaction is affected by changes in temperature not by changes in concentration. O Decreasing the concentration increases the reaction rate. PREVIOUS 17 of 25 NEXT SAVE & EXITarrow_forwardWhat purpose does the Artist wheel serve in chemistry?|arrow_forwardAnswer choices for blank 1: R S Answer choices for blank 2: R S Answer choices for blank 3: R S Answer choices for blank 4: R Sarrow_forwardIn a particular trial, a student got a value for R of 0.083. Calculate the percent deviation of this result. Enter a number without the % sign. The percent deviation should be reported as a positive value.arrow_forwardarrow_back_iosSEE MORE QUESTIONSarrow_forward_ios
Recommended textbooks for you
 ChemistryChemistryISBN:9781305957404Author:Steven S. Zumdahl, Susan A. Zumdahl, Donald J. DeCostePublisher:Cengage Learning
 ChemistryChemistryISBN:9781259911156Author:Raymond Chang Dr., Jason Overby ProfessorPublisher:McGraw-Hill Education
 Principles of Instrumental AnalysisChemistryISBN:9781305577213Author:Douglas A. Skoog, F. James Holler, Stanley R. CrouchPublisher:Cengage Learning
 Organic ChemistryChemistryISBN:9780078021558Author:Janice Gorzynski Smith Dr.Publisher:McGraw-Hill Education
 Chemistry: Principles and ReactionsChemistryISBN:9781305079373Author:William L. Masterton, Cecile N. HurleyPublisher:Cengage Learning
 Elementary Principles of Chemical Processes, Bind...ChemistryISBN:9781118431221Author:Richard M. Felder, Ronald W. Rousseau, Lisa G. BullardPublisher:WILEY

Chemistry
Chemistry
ISBN:9781305957404
Author:Steven S. Zumdahl, Susan A. Zumdahl, Donald J. DeCoste
Publisher:Cengage Learning

Chemistry
Chemistry
ISBN:9781259911156
Author:Raymond Chang Dr., Jason Overby Professor
Publisher:McGraw-Hill Education

Principles of Instrumental Analysis
Chemistry
ISBN:9781305577213
Author:Douglas A. Skoog, F. James Holler, Stanley R. Crouch
Publisher:Cengage Learning

Organic Chemistry
Chemistry
ISBN:9780078021558
Author:Janice Gorzynski Smith Dr.
Publisher:McGraw-Hill Education

Chemistry: Principles and Reactions
Chemistry
ISBN:9781305079373
Author:William L. Masterton, Cecile N. Hurley
Publisher:Cengage Learning

Elementary Principles of Chemical Processes, Bind...
Chemistry
ISBN:9781118431221
Author:Richard M. Felder, Ronald W. Rousseau, Lisa G. Bullard
Publisher:WILEY