The probability distribution for the number of sales done by a new Number of Sales per day x Number of days f P(x) 0 1 2 3 st 4 16 19 15 21 9 16 100 19 100 15 100 9 100 = 0.16 10 = = 0.19 21 = 0.21 100 = 0.15 = 0.09
Hi, could you please help me with graphing this on a Texas TI-84 plus CE graphing calculator. I put in all my data in L1 I make sure I only have one plot on and I make sure I am choosing the histogram option. However it appears that my window settings is completely wrong because I only see 5 bars and they do not match how the picture looks.

Trending now
This is a popular solution!
Step by step
Solved in 2 steps with 4 images

Hi,
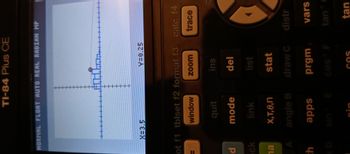
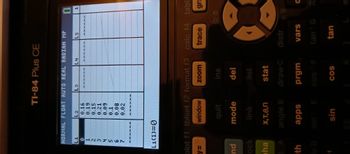
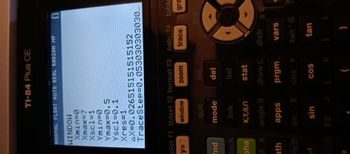
I'm sorry but I'm honestly not sure why this isn't working. I have tried this twice as you instructed. Here is a picture of the graph screen which is zoomed out, and also my data with L1 and L2 entered. The data for the window screen is the same as your calculator shows . What part am I missing? Thank you.


Hi,
What do I need to change so I see eight bars instead of only 7? Thank you.


