MATLAB: An Introduction with Applications
6th Edition
ISBN: 9781119256830
Author: Amos Gilat
Publisher: John Wiley & Sons Inc
expand_more
expand_more
format_list_bulleted
Question

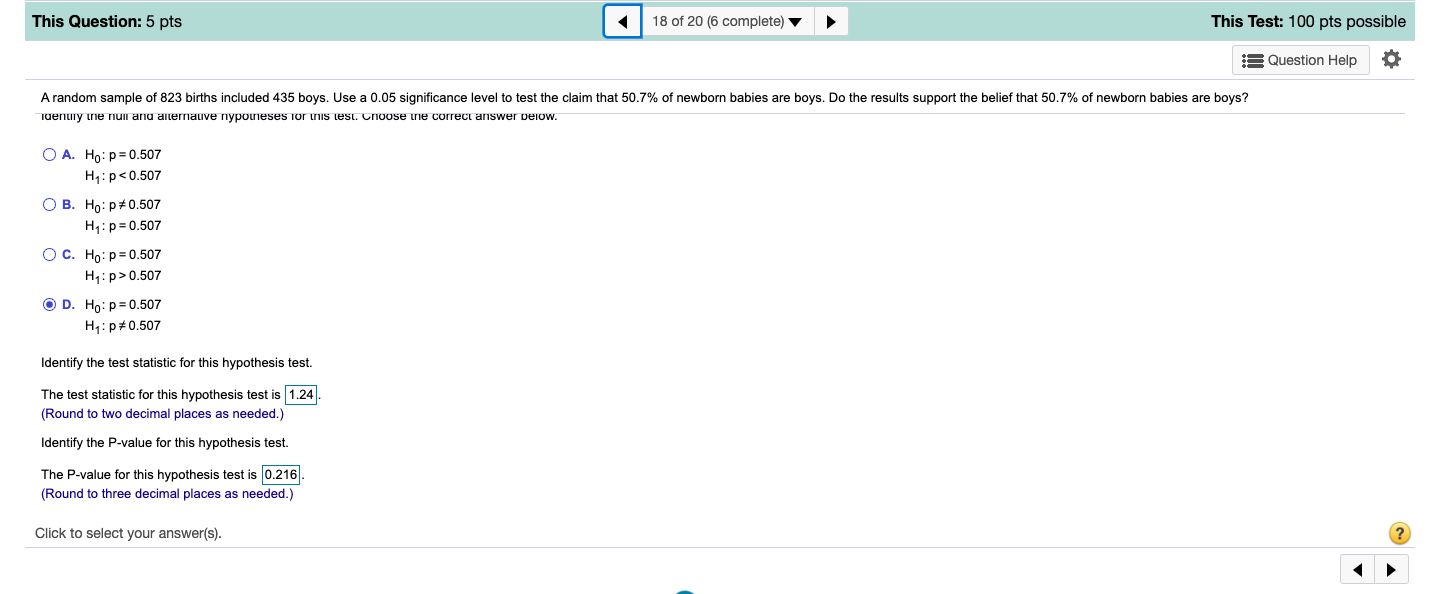
Transcribed Image Text:This Question: 5 pts
18 of 20 (6 complete) v
This Test: 100 pts possible
= Question Help
A random sample of 823 births included 435 boys. Use a 0.05 significance level to test the claim that 50.7% of newborn babies are boys. Do the results support the belief that 50.7% of newborn babies are boys?
Tdenuiy ne nuii and aiternauve nypouneses for is test. Choose ine correct ariswer pelow.
O A. Ho: p= 0.507
H1:p<0.507
О В. Но: р#0.507
H1:p= 0.507
Ос. Но: р30.507
H1:p>0.507
O D. Ho: p= 0.507
H:p#0.507
Identify the test statistic for this hypothesis test.
The test statistic for this hypothesis test is 1.24
(Round to two decimal places as needed.)
Identify the P-value for this hypothesis test.
The P-value for this hypothesis test is 0.216
(Round to three decimal places as needed.)
Click to select your answer(s).

Transcribed Image Text:Test: Week 4 Final Exam (whole course)
Time Remaining: 02:32:30 Submit Test
This Question: 5 pts
18 of 20 (6 complete) ▼
This Test: 100 pts possible
= Question Help
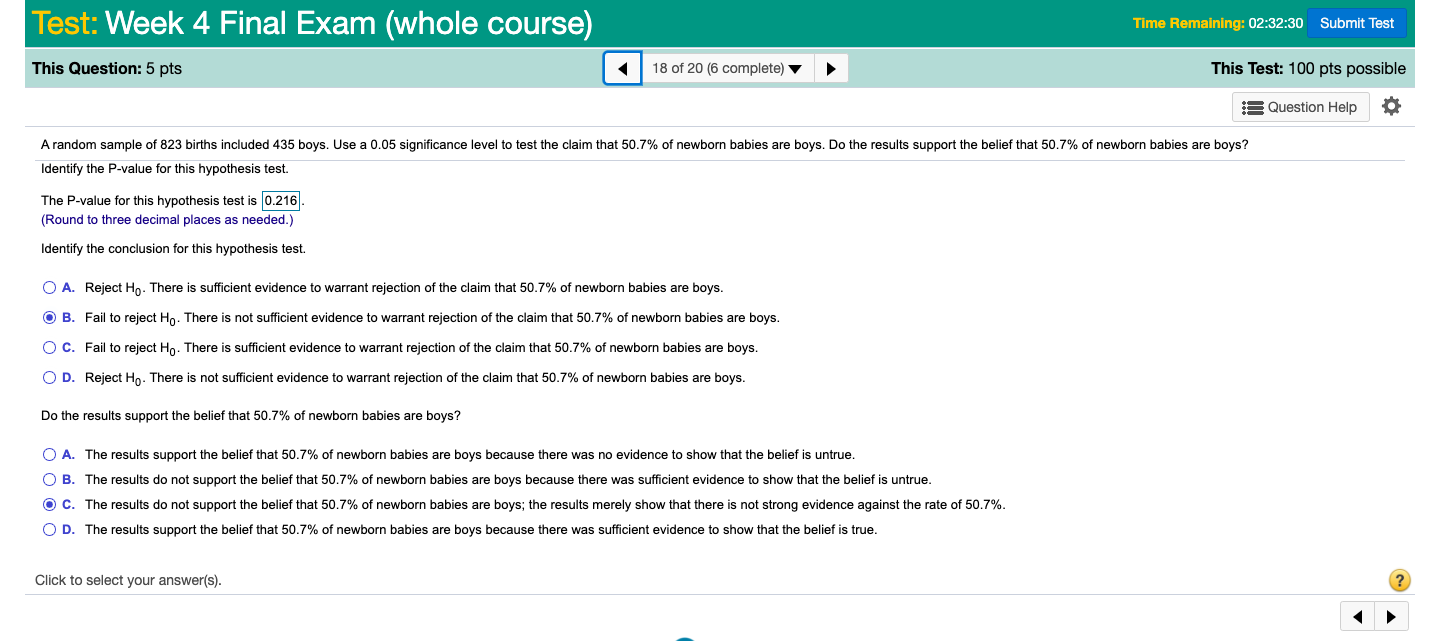
A random sample of 823 births included 435 boys. Use a 0.05 significance level to test the claim that 50.7% of newborn babies are boys. Do the results support the belief that 50.7% of newborn babies are boys?
Identify the P-value for this hypothesis test.
The P-value for this hypothesis test is 0.216.
(Round to three decimal places as needed.)
Identify the conclusion for this hypothesis test.
O A. Reject Ho. There is sufficient evidence to warrant rejection of the claim that 50.7% of newborn babies are boys.
O B. Fail to reject Ho. There is not sufficient evidence to warrant rejection of the claim that 50.7% of newborn babies are boys.
OC. Fail to reject Ho. There is sufficient evidence to warrant rejection of the claim that 50.7% of newborn babies are boys.
O D. Reject Ho. There is not sufficient evidence to warrant rejection of the claim that 50.7% of newborn babies are boys.
Do the results support the belief that 50.7% of newborn babies are boys?
O A. The results support the belief that 50.7% of newborn babies are boys because there was no evidence to show that the belief is untrue.
O B. The results do not support the belief that 50.7% of newborn babies are boys because there was sufficient evidence to show that the belief is untrue.
O C. The results do not support the belief that 50.7% of newborn babies are boys; the results merely show that there is not strong evidence against the rate of 50.7%.
O D. The results support the belief that 50.7% of newborn babies are boys because there was sufficient evidence to show that the belief is true.
Click to select your answer(s).
Expert Solution
This question has been solved!
Explore an expertly crafted, step-by-step solution for a thorough understanding of key concepts.
This is a popular solution
Trending nowThis is a popular solution!
Step by stepSolved in 3 steps with 3 images

Knowledge Booster
Similar questions
- Please helparrow_forwardWe would like to investigate if there is a difference in mean coffee consumption frequency between students at Rutgers, Princeton, and the University of Michigan. What test would we likely conduct? Independent samples t-test One Sample z-test Paired samples t-test One Way ANOVAarrow_forwardCompany records indicate that less than 24% of employees commute to work using public transportation. You suspect this is incorrect and for a sample of 157 employees, and find that 18% of them take public transportation to work. Test the claim using a 10% level of significance. What is the p-value for this test?arrow_forward
- Please find test statistic and p value. Thank you.arrow_forwardRun a single proportion test. Significance level= 0.05arrow_forwardYou want to compare differences in prior arrests across ethnicity in your study, you measured ethnicity as white =0 black =1 hispanic=2, and other =3. Prior arrests was recorded as the number of prior arrests. which test would you perform to see if arrests differ across diffrent ethnic categories? A. ANOVA B. T-testarrow_forward
- Please explain how the bolded option is the correct answerarrow_forwardhelparrow_forwardAccording to a survey conducted by the Association for Dressing and Sauces, 85% of American adults eat salad at least once a week. A nutritionist suspect that the percentage is higher that this. She conducts a survey of 200 American adults an finds that 171 of them eat salad at least once a week. Conduct the appropriate test that addresses the nutritionist's suspicions. Use the a = 0. 1 level of significance. What is the p-value? 0.85 0.855 0.1980 0.4215arrow_forward
- Can you answer whats blank?arrow_forwardEstimate of the proportion p for a 95% confidence with a sample size ? = 400 and point estimate ?̂= 0.4 Please provide it neatly with indicated given, formula, solution, and answer.arrow_forwardA professional marketing survey involves product recognition in New York and California. Of 558 New York residents surveyed, 193 knew the product while 179 out of 614 Californians knew the product. 1. Test the claim that the recognition rates are greater in New York. 2. In which state does the product need the most help with name recognition? Use the given data to compare mean age of residents in Seaside and Marina. Sample Data * = 43.2 yr s = 4.7 yr n = 97 Seaside Before After 1. Test the claim that the mean age of seaside residents is equal to the mean age of Marina residents. 2. How would the result change if we use a = 0.01? Matched Pairs: Write the alternative hypothesis H₁, for each claim: 1. New engine management software will increase the gas mileage in your car. 2. My coaching will reduce your golf score. Difference An instructor gives a test before and after a lesson with these results from randomly selected students Before and After Data 54 70 = 61 Marina 56 s = 6.7 year…arrow_forward
arrow_back_ios
arrow_forward_ios
Recommended textbooks for you
 MATLAB: An Introduction with ApplicationsStatisticsISBN:9781119256830Author:Amos GilatPublisher:John Wiley & Sons Inc
 Probability and Statistics for Engineering and th...StatisticsISBN:9781305251809Author:Jay L. DevorePublisher:Cengage Learning
 Statistics for The Behavioral Sciences (MindTap C...StatisticsISBN:9781305504912Author:Frederick J Gravetter, Larry B. WallnauPublisher:Cengage Learning
 Elementary Statistics: Picturing the World (7th E...StatisticsISBN:9780134683416Author:Ron Larson, Betsy FarberPublisher:PEARSON
 The Basic Practice of StatisticsStatisticsISBN:9781319042578Author:David S. Moore, William I. Notz, Michael A. FlignerPublisher:W. H. Freeman
 Introduction to the Practice of StatisticsStatisticsISBN:9781319013387Author:David S. Moore, George P. McCabe, Bruce A. CraigPublisher:W. H. Freeman

MATLAB: An Introduction with Applications
Statistics
ISBN:9781119256830
Author:Amos Gilat
Publisher:John Wiley & Sons Inc

Probability and Statistics for Engineering and th...
Statistics
ISBN:9781305251809
Author:Jay L. Devore
Publisher:Cengage Learning

Statistics for The Behavioral Sciences (MindTap C...
Statistics
ISBN:9781305504912
Author:Frederick J Gravetter, Larry B. Wallnau
Publisher:Cengage Learning

Elementary Statistics: Picturing the World (7th E...
Statistics
ISBN:9780134683416
Author:Ron Larson, Betsy Farber
Publisher:PEARSON

The Basic Practice of Statistics
Statistics
ISBN:9781319042578
Author:David S. Moore, William I. Notz, Michael A. Fligner
Publisher:W. H. Freeman

Introduction to the Practice of Statistics
Statistics
ISBN:9781319013387
Author:David S. Moore, George P. McCabe, Bruce A. Craig
Publisher:W. H. Freeman