Advanced Engineering Mathematics
10th Edition
ISBN: 9780470458365
Author: Erwin Kreyszig
Publisher: Wiley, John & Sons, Incorporated
expand_more
expand_more
format_list_bulleted
Question
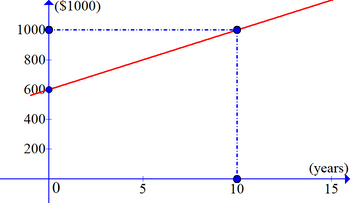
This graph represents the expected price of the house after t years.
- Find a linear equation for this graph.
- If the house was purchased for $600,000 in 2015, when is it expected that its value will double?

Transcribed Image Text:10000
800-
6000
400-
200+
($1000)
0
5
10
(years)
15
Expert Solution
This question has been solved!
Explore an expertly crafted, step-by-step solution for a thorough understanding of key concepts.
This is a popular solution
Trending nowThis is a popular solution!
Step by stepSolved in 3 steps

Follow-up Questions
Read through expert solutions to related follow-up questions below.
Follow-up Question
i do not understand the part 2 of question please explain?
Solution
by Bartleby Expert
Follow-up Question
which formula you used in step 2? please c;lear
Solution
by Bartleby Expert
Follow-up Questions
Read through expert solutions to related follow-up questions below.
Follow-up Question
i do not understand the part 2 of question please explain?
Solution
by Bartleby Expert
Follow-up Question
which formula you used in step 2? please c;lear
Solution
by Bartleby Expert
Knowledge Booster
Similar questions
- solve 5 a and b.arrow_forwardWhen we chart the price of milk in 1995 dollars we find that it has become slightly more expensive ,but when we chart it in 1975 dollars we find that it has become cheaper. Which statement is correct ?? a. Not make sense, because prices always rise with time b. Not make sense, because the same trend would be seen regardless of what kind of dollars are used c.make sense, because 1975 dollars are worth than 1995 dollars d.make sense,because 1995 dollars more worth than 1975 dollarsarrow_forwardUsing Social Security Administration data for selected years from 2012 and projected to 2050, the U.S. consumer price index (CPI) can be modeled by the function y = 0.0682x² + 1.76x + 96.0 where x is the number of years past 2010 and y is the CPI in dollars. With a reference of 100 in 2012, a CPI of 120 in another year means that goods and services costing $100 in 2012 are expected to cost $120 in that other year (a) Use a table to determine a viewing window that shows a complete graph of this function for the years from 2010 to 2050. 2050 corresponds to an x value of which corresponds to a y value of The y maximum should be -Select-than this function value (b) Graph the function. y 300 250 200 150 100 50 0 y 300 250 200 150 100 50 X = Need Help? 51 F Partly sunny 10 10 20 Read It 20 30 30 T X 40 40 y 300 250 200 150 100 50 0 0 10 (c) Use the graph to estimate when the CPI is predicted to reach 250. (Round your answer to the nearest whole year.) years 20 30 Q Search 40 y 300 250 200…arrow_forward
- Student Loans Data for selected years from 2011and projected to 2023 can be used to show that thebalance of federal direct student loans y, in billions ofdollars, is related to the number of years after 2010,x, by the function y = 130.7x + 699.7.a. Graph the function for x-values corresponding2010 to 2025.b. Find the value of y when x is 13.c. What does this function predict the balance offederal direct student loans will be in 2029?(Source: U.S. Office of Management and Budget)arrow_forwardNo hand written solution and no imagearrow_forwardThe marching band at a local high school is selling candy bars. The profits will go toward the purchase of new marching band uniforms. They are interested in knowing what price they should charge to obtain the maximum profit. The candy bars are donated by a local retailer so they know that if they charge $0 they will make $0 profit. They also collect data from other marching bands who have sold candy bars in the past. The data they collected is shown in the table below. Price 0.00 0.45 0.60 0.75 1.00 1.25 1.40 1.50 Profit 0.00 $720 $900 $990 $845 $625 $560 $300 What factors might influence how much is to be made from the candy sale? Give at least two. What happens to the profit as the price of each candy bar increases? Explain possible reasons for your observations. How do you suppose the other bands determined the price at which to sell each candy bar? Do any data values seem unusual? Yes or…arrow_forward
arrow_back_ios
arrow_forward_ios
Recommended textbooks for you
 Advanced Engineering MathematicsAdvanced MathISBN:9780470458365Author:Erwin KreyszigPublisher:Wiley, John & Sons, Incorporated
 Numerical Methods for EngineersAdvanced MathISBN:9780073397924Author:Steven C. Chapra Dr., Raymond P. CanalePublisher:McGraw-Hill Education
 Introductory Mathematics for Engineering Applicat...Advanced MathISBN:9781118141809Author:Nathan KlingbeilPublisher:WILEY
 Mathematics For Machine TechnologyAdvanced MathISBN:9781337798310Author:Peterson, John.Publisher:Cengage Learning,


Advanced Engineering Mathematics
Advanced Math
ISBN:9780470458365
Author:Erwin Kreyszig
Publisher:Wiley, John & Sons, Incorporated

Numerical Methods for Engineers
Advanced Math
ISBN:9780073397924
Author:Steven C. Chapra Dr., Raymond P. Canale
Publisher:McGraw-Hill Education

Introductory Mathematics for Engineering Applicat...
Advanced Math
ISBN:9781118141809
Author:Nathan Klingbeil
Publisher:WILEY

Mathematics For Machine Technology
Advanced Math
ISBN:9781337798310
Author:Peterson, John.
Publisher:Cengage Learning,

