ENGR.ECONOMIC ANALYSIS
14th Edition
ISBN: 9780190931919
Author: NEWNAN
Publisher: Oxford University Press
expand_more
expand_more
format_list_bulleted
Question
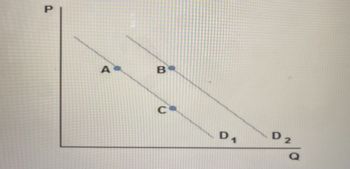
This graph illustrates the demand for a normal good.
A movement from A to C on the graph presented can be caused by:
• a) a price decrease.
• b) a decrease in income.
• c) a price increase.
• d) an increase in income.

Transcribed Image Text:P
A
B
с
D1
D2
Expert Solution
This question has been solved!
Explore an expertly crafted, step-by-step solution for a thorough understanding of key concepts.
This is a popular solution
Trending nowThis is a popular solution!
Step by stepSolved in 3 steps

Knowledge Booster
Learn more about
Need a deep-dive on the concept behind this application? Look no further. Learn more about this topic, economics and related others by exploring similar questions and additional content below.Similar questions
- As the price of bananas increases, ceteris paribus, the law of demand implies A. the quantity of bananas demanded will decrease. B. the demand for bananas will decrease. C. the quantity of bananas demanded will increase. D. the demand for bananas will increase.arrow_forwardSuppose that the table on the right shows the quantity demanded of UGG boots at five different prices in 2014 and in 2015. Which of the following variables could cause the quantity demanded of UGG boots to change as indicated from 2014 to 2015? (Check all that apply.) A. An increase in the price of UGG boots B. A decrease in the price of a substitute good C. A decrease in the number of buyers D. The expectation that UGG boots will rise in price Price $160 170 180 190 200 Quantity Demanded 2014 5000 4500 4000 3500 3000 Quantity Demanded 2015 4000 3500 3000 2500 2000arrow_forwardP A D quantity Refer to Figure 4-1. The movement from point A to point B on the graph shows a(n) a. decrease in demand. b. increase in demand. C. decrease in quantity demanded. d. increase in quantity demanded.arrow_forward
- When there is an increase in demand,A. the demand curve shifts to the right of the original demand curve.B. the demand curve rotates clockwise.C. the demand curve shifts to the left of the original demand curve.D. the demand curve rotates counterclockwise.E. a lower price has increased the amount of the good that consumers will buy.arrow_forwardsuppose pizzas and burgers are substitutes. what will definitely happen if there is an increase in the price of pizza? a. demand for burgers will increase. b. supply of burgers will decrease. c. demand for burgers will decrease. d. supply of burgers will increase.arrow_forwardⒸ Macmillan Learning If the price of gasoline rises, what response do you expect in the market for SUVs? Shift the demand curve to show what happens in the market for SUVs when the price of gasoline rises. Price Market for SUVS Demand for SUVS Quantity of SUVSarrow_forward
- Price P₂ P1 Price ↓ (a) (c) D₂ D₁ Quantity Quantity Price (b) D₁ Quantity Main Carrow_forwardChapter 3 Review Quantity Figure 3-1 6. Refer to Figure 3-1. Using the graph above and beginning on D1, a shift to D2 would indicate a (n): A. increase in quantity demanded. B. decrease in quantity demanded. C. increase in demand. D. decrease in demand. Pricearrow_forward3. If the demand for a product is perfectly price inelastic, what does the corresponding price consumption curve look like? Draw a graph to show the price consumption curve.arrow_forward
- 1. Which of the following is NOT true of a demand curve? a. It has negative slope. b. It shows the amount consumers are willing and able to purchase at various prices, holding other factors constant. c. It relates the price of an item to the quantity demanded of that item. d. It shows how an increase in price leads to an increase in quantity demanded of a good.arrow_forwardThe law of demand implies, holding everything else constant, that as the price of pizza Select one: A. decreases, the demand for pizza will increase. B. decreases, the quantity of pizza demanded will decrease. C. decreases, the demand for pizza remains unchanged. D. increases, the demand for pizza will increase. E. increases, the quantity of pizza demanded will decrease.arrow_forwardHot dogs and hot dog buns are complimentary goods. Therefore, an increase in the price of hot dogs would cause the demand for hot dog buns to A- decrease. B-stay the same. C-not change. D-increase.arrow_forward
arrow_back_ios
arrow_forward_ios
Recommended textbooks for you

 Principles of Economics (12th Edition)EconomicsISBN:9780134078779Author:Karl E. Case, Ray C. Fair, Sharon E. OsterPublisher:PEARSON
 Engineering Economy (17th Edition)EconomicsISBN:9780134870069Author:William G. Sullivan, Elin M. Wicks, C. Patrick KoellingPublisher:PEARSON
 Principles of Economics (MindTap Course List)EconomicsISBN:9781305585126Author:N. Gregory MankiwPublisher:Cengage Learning
 Managerial Economics: A Problem Solving ApproachEconomicsISBN:9781337106665Author:Luke M. Froeb, Brian T. McCann, Michael R. Ward, Mike ShorPublisher:Cengage Learning
 Managerial Economics & Business Strategy (Mcgraw-...EconomicsISBN:9781259290619Author:Michael Baye, Jeff PrincePublisher:McGraw-Hill Education


Principles of Economics (12th Edition)
Economics
ISBN:9780134078779
Author:Karl E. Case, Ray C. Fair, Sharon E. Oster
Publisher:PEARSON

Engineering Economy (17th Edition)
Economics
ISBN:9780134870069
Author:William G. Sullivan, Elin M. Wicks, C. Patrick Koelling
Publisher:PEARSON

Principles of Economics (MindTap Course List)
Economics
ISBN:9781305585126
Author:N. Gregory Mankiw
Publisher:Cengage Learning

Managerial Economics: A Problem Solving Approach
Economics
ISBN:9781337106665
Author:Luke M. Froeb, Brian T. McCann, Michael R. Ward, Mike Shor
Publisher:Cengage Learning

Managerial Economics & Business Strategy (Mcgraw-...
Economics
ISBN:9781259290619
Author:Michael Baye, Jeff Prince
Publisher:McGraw-Hill Education