MATLAB: An Introduction with Applications
6th Edition
ISBN: 9781119256830
Author: Amos Gilat
Publisher: John Wiley & Sons Inc
expand_more
expand_more
format_list_bulleted
Question

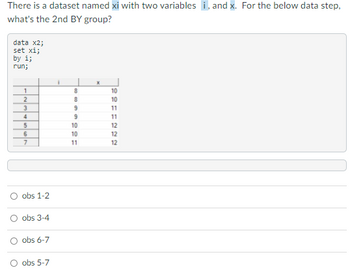
Transcribed Image Text:There is a dataset named xi with two variables i, and x. For the below data step,
what's the 2nd BY group?
data x2;
set xi;
by i;
run;
1
2
3
4
5
6
7
obs 1-2
obs 3-4
obs 6-7
O obs 5-7
i
60808
9
9
10
10
11
X
10
SFF22
10
11
11
12
12
12
Expert Solution
This question has been solved!
Explore an expertly crafted, step-by-step solution for a thorough understanding of key concepts.
This is a popular solution
Trending nowThis is a popular solution!
Step by stepSolved in 3 steps with 18 images

Knowledge Booster
Similar questions
- Please provide only part C Please do it in 30 minutesarrow_forwardPlease see attachment for math question.arrow_forwardThe following list gives the number of pets for each of 10 students. 1, 0, 4, 3, 7, 2, 11, 9, 10, 6 Find the modes of this data set. If there is more than one mode, write them separated by commas.If there is no mode, click on "No mode."arrow_forward
- Here is a set of data. 6 7 260 301 338 417 504 623 649 714 867 907 Identify the 5 number summary (min, Q1, median, Q3, max) , , , ,arrow_forwardAssitance with the following please. Using the information given in the image. c. Compare the variation in the number of driving citations and the annual income. Explain why you choose this method to compare the variations?arrow_forwardTyped please and asaparrow_forward
- The basketball coach at a local college believes that his team scores more points at home games when more people show up. Below is a list of all home games last year with scores and corresponding attendance. Use Excel, SPSS, or work by hand to show your work finding r. Show your work on the attached pages. Score Attendance Score Attendance 54 380 67 410 57 350 78 215 59 320 67 113 80 478 56 250 82 451 85 450 75 250 101 489 73 489 99 472 53 451 What is the obtained t-score for this correlation? What is the critical t-score for a two-tailed test with a = 0.05? Is this correlation significant based on the t-scores?arrow_forwardWhat percentage of data would you predict would be between 25 and 50 and what percentage would you predict would be more than 50 miles? Use the Week 4 spreadsheet again to find the percentage of the data set we expect to have values between 25 and 50 as well as for more than 50. Now determine the percentage of data points in the dataset that fall within each of these ranges, using same strategy as above for counting data points in the data set. How do each of these compare with your prediction and why is there a difference? Predicted percentage between 25 and 50: ________________________ Actual percentage: Predicted percentage more than 50 miles: Actual percentage: ___________________________________________ Comparison ____________________________________________________ Why? __________________________________________________________ Drive: 44 20 88 6 71 42 76 63 61 63 84 28 55 33 88 80 86 83 5 85 25 25 54 54 81 73 29 76 78…arrow_forwardSuppose you have access to a database with the variables listed below. Choose two variables you are interested in exploring that may be related (a predictor and outcome). Which variable is your y (outcome) and which is your x (predictor)? *Hint: which one may predict the other? Example: hot weather may predict sunburns.arrow_forward
- Here is a set of data. 27 231 276 283 299 308 321 407 567 584 587 625 737 830 966 974 Identify the 5 number summary (min, Q1, median, Q3, max)arrow_forwardBelow is data for two variables, X and Y. Answer the questions that follow. X Y X-MX Y-MY (X-MX)2 (Y-MY)2 (X-MX)(Y-MY) 3 3 -2 -1 4 1 2 4 3 -1 -1 1 1 ___ 6 4 1 ___ 1 0 0 7 6 2 2 ___ 4 4 r = ____arrow_forward−13,−13,−13,0,0,0,11−13,−13,−13,0,0,0,11 Determine if the data set is unimodal, bimodal, multimodal, or has no mode. Identify the mode(s), if any exist.arrow_forward
arrow_back_ios
SEE MORE QUESTIONS
arrow_forward_ios
Recommended textbooks for you
 MATLAB: An Introduction with ApplicationsStatisticsISBN:9781119256830Author:Amos GilatPublisher:John Wiley & Sons Inc
 Probability and Statistics for Engineering and th...StatisticsISBN:9781305251809Author:Jay L. DevorePublisher:Cengage Learning
 Statistics for The Behavioral Sciences (MindTap C...StatisticsISBN:9781305504912Author:Frederick J Gravetter, Larry B. WallnauPublisher:Cengage Learning
 Elementary Statistics: Picturing the World (7th E...StatisticsISBN:9780134683416Author:Ron Larson, Betsy FarberPublisher:PEARSON
 The Basic Practice of StatisticsStatisticsISBN:9781319042578Author:David S. Moore, William I. Notz, Michael A. FlignerPublisher:W. H. Freeman
 Introduction to the Practice of StatisticsStatisticsISBN:9781319013387Author:David S. Moore, George P. McCabe, Bruce A. CraigPublisher:W. H. Freeman

MATLAB: An Introduction with Applications
Statistics
ISBN:9781119256830
Author:Amos Gilat
Publisher:John Wiley & Sons Inc

Probability and Statistics for Engineering and th...
Statistics
ISBN:9781305251809
Author:Jay L. Devore
Publisher:Cengage Learning

Statistics for The Behavioral Sciences (MindTap C...
Statistics
ISBN:9781305504912
Author:Frederick J Gravetter, Larry B. Wallnau
Publisher:Cengage Learning

Elementary Statistics: Picturing the World (7th E...
Statistics
ISBN:9780134683416
Author:Ron Larson, Betsy Farber
Publisher:PEARSON

The Basic Practice of Statistics
Statistics
ISBN:9781319042578
Author:David S. Moore, William I. Notz, Michael A. Fligner
Publisher:W. H. Freeman

Introduction to the Practice of Statistics
Statistics
ISBN:9781319013387
Author:David S. Moore, George P. McCabe, Bruce A. Craig
Publisher:W. H. Freeman