
MATLAB: An Introduction with Applications
6th Edition
ISBN: 9781119256830
Author: Amos Gilat
Publisher: John Wiley & Sons Inc
expand_more
expand_more
format_list_bulleted
Related questions
Question
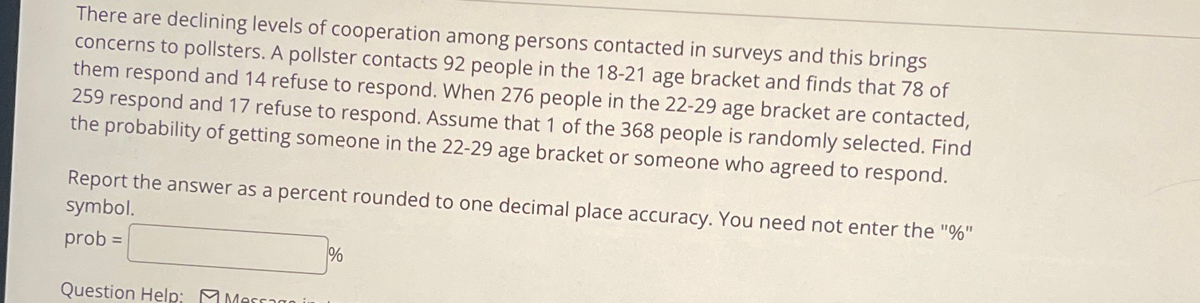

Transcribed Image Text:There are declining levels of cooperation among persons contacted in surveys and this brings
concerns to pollsters. A pollster contacts 92 people in the 18-21 age bracket and finds that 78 of
them respond and 14 refuse to respond. When 276 people in the 22-29 age bracket are contacted,
259 respond and 17 refuse to respond. Assume that 1 of the 368 people is randomly selected. Find
the probability of getting someone in the 22-29 age bracket or someone who agreed to respond.
Report the answer as a percent rounded to one decimal place accuracy. You need not enter the "%"
symbol.
prob =
Question Help: M Mes
Expert Solution
This question has been solved!
Explore an expertly crafted, step-by-step solution for a thorough understanding of key concepts.

This is a popular solution

Trending nowThis is a popular solution!

Step by stepSolved in 2 steps

Knowledge Booster

Similar questions
- 105, 82, 94.5, 72.5, 92, 91, 52, 86, 100, 96, 98, 109, 96, 36, 98, 95arrow_forward3. Pollsters are concerned about declining levels of cooperation among persons contacted in surveys. A pollster contacts 73 people in the 18-21 age bracket and finds that 62 of them respond and 11 refuse to respond. When 303 people in the 22-29 age bracket are contacted, 273 respond and 30 refuse to respond. Assume that 1 of the 376 people is randomly selected. Find the probability of getting someone in the 22-29 age bracket or someone who responds.Report the answer as a percent rounded to one decimal place accuracy. You need not enter the "%" symbol.P(22-29 or responds) = %arrow_forwardWhen two births are randomly selected, the sample space for genders is bb, bg. gb, and gg. Assume that those four outcomes are equally likely. Construct a table that describes the sampling distribution of the sample proportion of girls from two births. Does the mean of the sample proportions equal the proportion of girls in two births? Does the result suggest that a sample proportion an unbiased estimator of a population proportion? For the entire population, assume the probability of having a boy is the probability of having a girl is , and this is not affected by how many boys or girls have previously been born. 2 Determine the probabilities of each sample proportion. Probability Sample proportion of girls Tune intanare or cimnlifiad frartinnearrow_forward
- Assume that 800 births are randomly selected and 39 of the births are girls. Use subjective judgment to describe the number of girls as significantly high, significantly low, or neither significantly low nor significantly high.arrow_forwardA survey showed that 76% of adults need correction (eyeglasses, contacts, surgery, etc.) for their eyesight. If 14 adults are randomly selected, find the probability that at least 13 of them need correction for their eyesight. Is 13 a significantly high number of adults requiring eyesight correction?arrow_forwardIn a recent poll of voters, 20% were displeased with both candidates. If 3 people were picked at random. find the probability that at least one liked one of the candidates.arrow_forward
- The tickets in a box have an average value of 75, and the SD is 10. Twenty-five draws are made at random with replacement from this box. Find the chance that the average of the draws will be in the range 65 to 85.arrow_forwardFewer young people are driving. In 1995, 63.9% of people under 20 years old who were eligible had a driver's license. Bloomberg reported that percentage had dropped to 41.7% in 2016. Suppose these results are based on a random sample of 1,200 people under 20 years old who were eligible to have a driver's license in 1995 and again in 2016.arrow_forward. If tossing a loaded coin gives heads 60% of times, what is the likelihood (probability) of observing heads 50 times or fewer out of 100 tosses? 12 The probability of observing heads 50 times or fewer out of 100 would be 0.03 or 3 percent. use excel.arrow_forward
- 5. Are whites more likely to claim bias? It was found that 40% of the workers were white, 35% were black and 25% are other races. Given that a worker was white, the probability that the worker had claimed bias was 20%.Given that a worker was black, the probability that the worker had claimed bias was 65%. Given that a worker was other race, the probability that the worker had claimed bias was 55%. If a randomly selected worker had claimed bias, what is the probability that the worker is black? a) 0.5112 b) 0.2308 c) 0.3461 d) 0.6296arrow_forwardOne cable company advertises that it has excellent customer service. In fact, the company advertises that a technician will be there within 30 minutes of when a service call is placed. One frustrated customer believes this is not the truth, claiming that it takes over 30 minutes for the cable repairman to arrive. The customer asks 15 of his neighbors how long it has taken for the cable repairman to arrive when they have called for him. The sample mean for this group is 32.2 minutes with a sample standard deviation of 3.6 minutes. Test the customer’s claim at the 0.02 level of significance. (a) State the null and alternative hypotheses (b) Find the value of your test statistic. Draw a picture and label its location on the normal curve. Also shade the area where you will find the p-value. (c) Calculate the p-value from the sample data. Compare it to the significance level. Label it’s value and location on your bell curve (d) Write a full…arrow_forwardA journalist randomly asked 108 men and 142 women if they had texted while driving anytime during the past month. Of those questioned, 51 men and 73 women admitted that they did. Does the journalist have enough evidence to indicate that there is no significant difference in the percentage of men and the percentage of women who text while driving?arrow_forward
arrow_back_ios
SEE MORE QUESTIONS
arrow_forward_ios
Recommended textbooks for you
- MATLAB: An Introduction with ApplicationsStatisticsISBN:9781119256830Author:Amos GilatPublisher:John Wiley & Sons Inc
 Probability and Statistics for Engineering and th...StatisticsISBN:9781305251809Author:Jay L. DevorePublisher:Cengage Learning
 Statistics for The Behavioral Sciences (MindTap C...StatisticsISBN:9781305504912Author:Frederick J Gravetter, Larry B. WallnauPublisher:Cengage Learning
  Elementary Statistics: Picturing the World (7th E...StatisticsISBN:9780134683416Author:Ron Larson, Betsy FarberPublisher:PEARSON
 The Basic Practice of StatisticsStatisticsISBN:9781319042578Author:David S. Moore, William I. Notz, Michael A. FlignerPublisher:W. H. Freeman
 Introduction to the Practice of StatisticsStatisticsISBN:9781319013387Author:David S. Moore, George P. McCabe, Bruce A. CraigPublisher:W. H. Freeman
MATLAB: An Introduction with Applications
Statistics
ISBN:9781119256830
Author:Amos Gilat
Publisher:John Wiley & Sons Inc
Probability and Statistics for Engineering and th...
Statistics
ISBN:9781305251809
Author:Jay L. Devore
Publisher:Cengage Learning
Statistics for The Behavioral Sciences (MindTap C...
Statistics
ISBN:9781305504912
Author:Frederick J Gravetter, Larry B. Wallnau
Publisher:Cengage Learning
Elementary Statistics: Picturing the World (7th E...
Statistics
ISBN:9780134683416
Author:Ron Larson, Betsy Farber
Publisher:PEARSON
The Basic Practice of Statistics
Statistics
ISBN:9781319042578
Author:David S. Moore, William I. Notz, Michael A. Fligner
Publisher:W. H. Freeman
Introduction to the Practice of Statistics
Statistics
ISBN:9781319013387
Author:David S. Moore, George P. McCabe, Bruce A. Craig
Publisher:W. H. Freeman