
MATLAB: An Introduction with Applications
6th Edition
ISBN: 9781119256830
Author: Amos Gilat
Publisher: John Wiley & Sons Inc
expand_more
expand_more
format_list_bulleted
Related questions
Topic Video
Question
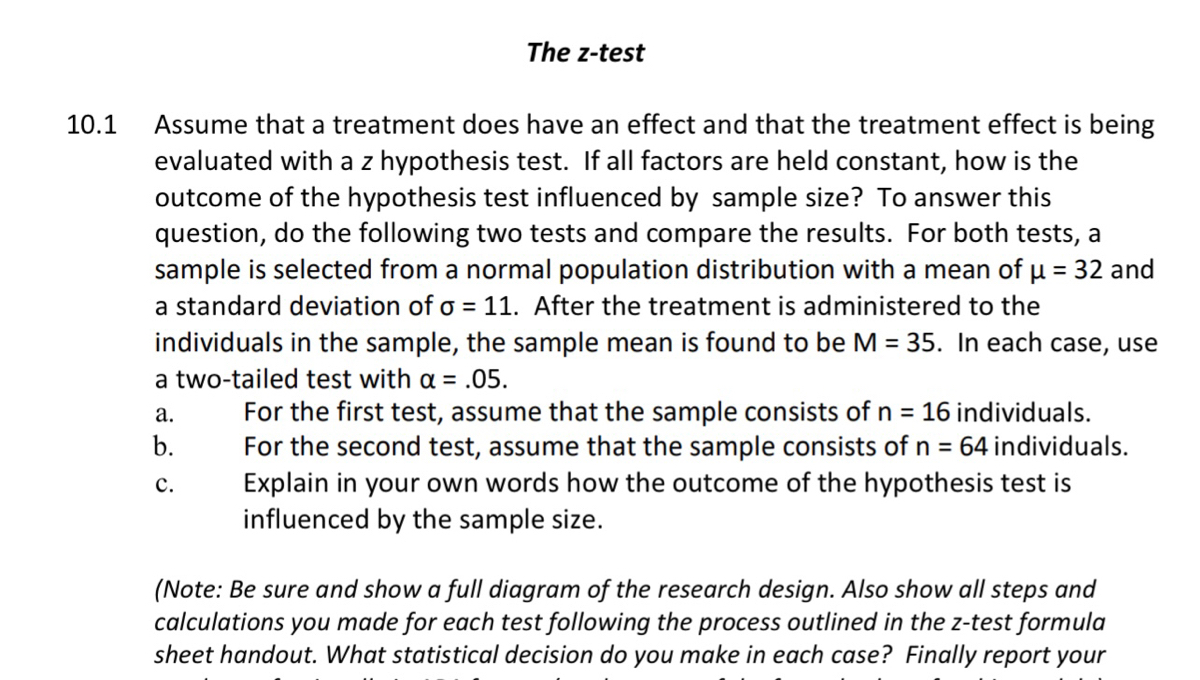

Transcribed Image Text:The z-test
Assume that a treatment does have an effect and that the treatment effect is being
evaluated with a z hypothesis test. If all factors are held constant, how is the
outcome of the hypothesis test influenced by sample size? To answer this
question, do the following two tests and compare the results. For both tests, a
sample is selected from a normal population distribution with a mean of u = 32 and
a standard deviation of o = 11. After the treatment is administered to the
individuals in the sample, the sample mean is found to be M = 35. In each case, use
10.1
a two-tailed test with a = .05.
For the first test, assume that the sample consists of n = 16 individuals.
For the second test, assume that the sample consists of n = 64 individuals.
Explain in your own words how the outcome of the hypothesis test is
influenced by the sample size.
а.
b.
с.
(Note: Be sure and show a full diagram of the research design. Also show all steps and
calculations you made for each test following the process outlined in the z-test formula
sheet handout. What statistical decision do you make in each case? Finally report your
Expert Solution
This question has been solved!
Explore an expertly crafted, step-by-step solution for a thorough understanding of key concepts.

This is a popular solution

Trending nowThis is a popular solution!

Step by stepSolved in 2 steps with 2 images

Knowledge Booster


Learn more about
Need a deep-dive on the concept behind this application? Look no further. Learn more about this topic, statistics and related others by exploring similar questions and additional content below.Similar questions
- For an ANOVA comparing three treatment conditions, what is stated by the null hypothesis (HO)? Question 14 options: There are no differences between any of the population means. At least one of the three population means is different from another mean. All three of the population means are different from each other. None of the other choices is correct.arrow_forwardIn a neuroscience research lab, the researchers want to know the effects of long-term marijuana use on memory and reaction times. In order to investigate their research hypothesis a sample of 50 long-term marijuana users between the ages of 35-45 were selected with a mean memory and reaction time of 69.4 seconds. The population average for the same age group has a mean of 48 and S.E.M. is 7. Go through the steps of hypothesis testing, select appropriate statistics and state your results, use a=.05.arrow_forwardA researcher conducts a study examining the effectiveness of a group exercise program at an assisted living facility for elderly adults. One group of residents is selected to participate in the program, and a second group serves as a control. After 12 weeks, the researcher records a combined score measuring balance and strength for each individual. The data are as follows: Control n = 20 M = 24 SS = 241Exercise n = 30 M = 31 SS = 380 a. Use a two-tailed test with a = 0.1. Conduct the four steps for hypothesis testing and label each step: Step1, Step 2, Step 3, and Step 4.arrow_forward
- A researcher administers a new treatment to a sample of participants selected from a population with µ = 80. If the researcher obtains a sample mean of M = 88, which combination of factors is most likely to result in rejecting the null hypothesis?arrow_forwardIf a treatment is expected to decrease scores on a variable for which the mean is expected to be µ = 50, what is the null hypothesis?arrow_forwardA two-tailed hypothesis test is being used to evaluate a treatment effect with α = .05. If the sample data produce a z-score of z = -0.43, then what is the correct decision? a. Reject the null hypothesis and conclude that the treatment has an effect. b. Reject the null hypothesis and conclude that the treatment has no effect. c. Fail to reject the null hypothesis and conclude that the treatment has no effect. d. Fail to reject the null hypothesis and conclude that the treatment has an effect.arrow_forward
- Below indicate whether the appropriate test would be an independent t-test, dependent t-test, One-way ANOVA, or z-test. . A statistics professor wants to know if students who turn their homework in on time get higher exam grades than students who do not turn their homework in on time.arrow_forwardFunctional foods are those containing nutritional supplements in addition to natural nutrients. For example, orange juice with calcium. A researcher asked students to rate their general attitude towards functional foods on a 7-point scale (higher score is more positive). The results are as follow: Females Males n = 15 n = 12 M = 5 M = 4 SS = 7 SS = 8 a. Do the data indicate a significant difference in attitude for males and females? Use a two-tailed test with α = .05 b. Your alternative hypothesis in symbols is c. The critical tvalues are d. The t-statistic is: e. Your decision is f. r2 is:arrow_forwardYou are conducting a study to see if the proportion of men over 50 who regularly have their prostate examined is significantly different from 0.25. You use a significance level of α=0.01α=0.01. H0:p=0.25H0:p=0.25 H1:p≠0.25H1:p≠0.25You obtain a sample of size n=687n=687 in which there are 143 successes.What is the test statistic for this sample? (Report answer accurate to three decimal places.)test statistic = What is the p-value for this sample? (Report answer accurate to four decimal places.)p-value =arrow_forward
- Researchers investigate how the presence of cell phones influence the quality of human interaction. Subjects are randomly selected from a population and divided into an experimental group that is asked to leave their phones in the front of the room and a control group that are not asked to leave their cell phones at the front of the room. Subjects are left alone for 10 minutes and then asked to take a survey designed to measure quality of interactions they had with others in the experiment. What statistical test is appropriate?arrow_forwardThe pulse rates of 176 randomly selected adult males vary from a low of 40 bpm to a high of 116 bpm. Find the minimum sample size required to estimate the mean pulse rate of adult males. Assume that we want 95% confidence that the sample mean is within 2 bpm of the population mean.arrow_forwardReject or Fail to Reject the null hypothesis. There is or is not sufficient evidence to support the claim that those treated with magnets have a greater mean reduction in pain than those given a sham treatment.arrow_forward
arrow_back_ios
SEE MORE QUESTIONS
arrow_forward_ios
Recommended textbooks for you
- MATLAB: An Introduction with ApplicationsStatisticsISBN:9781119256830Author:Amos GilatPublisher:John Wiley & Sons Inc
 Probability and Statistics for Engineering and th...StatisticsISBN:9781305251809Author:Jay L. DevorePublisher:Cengage Learning
 Statistics for The Behavioral Sciences (MindTap C...StatisticsISBN:9781305504912Author:Frederick J Gravetter, Larry B. WallnauPublisher:Cengage Learning
  Elementary Statistics: Picturing the World (7th E...StatisticsISBN:9780134683416Author:Ron Larson, Betsy FarberPublisher:PEARSON
 The Basic Practice of StatisticsStatisticsISBN:9781319042578Author:David S. Moore, William I. Notz, Michael A. FlignerPublisher:W. H. Freeman
 Introduction to the Practice of StatisticsStatisticsISBN:9781319013387Author:David S. Moore, George P. McCabe, Bruce A. CraigPublisher:W. H. Freeman
MATLAB: An Introduction with Applications
Statistics
ISBN:9781119256830
Author:Amos Gilat
Publisher:John Wiley & Sons Inc
Probability and Statistics for Engineering and th...
Statistics
ISBN:9781305251809
Author:Jay L. Devore
Publisher:Cengage Learning
Statistics for The Behavioral Sciences (MindTap C...
Statistics
ISBN:9781305504912
Author:Frederick J Gravetter, Larry B. Wallnau
Publisher:Cengage Learning
Elementary Statistics: Picturing the World (7th E...
Statistics
ISBN:9780134683416
Author:Ron Larson, Betsy Farber
Publisher:PEARSON
The Basic Practice of Statistics
Statistics
ISBN:9781319042578
Author:David S. Moore, William I. Notz, Michael A. Fligner
Publisher:W. H. Freeman
Introduction to the Practice of Statistics
Statistics
ISBN:9781319013387
Author:David S. Moore, George P. McCabe, Bruce A. Craig
Publisher:W. H. Freeman