MATLAB: An Introduction with Applications
6th Edition
ISBN: 9781119256830
Author: Amos Gilat
Publisher: John Wiley & Sons Inc
expand_more
expand_more
format_list_bulleted
Question

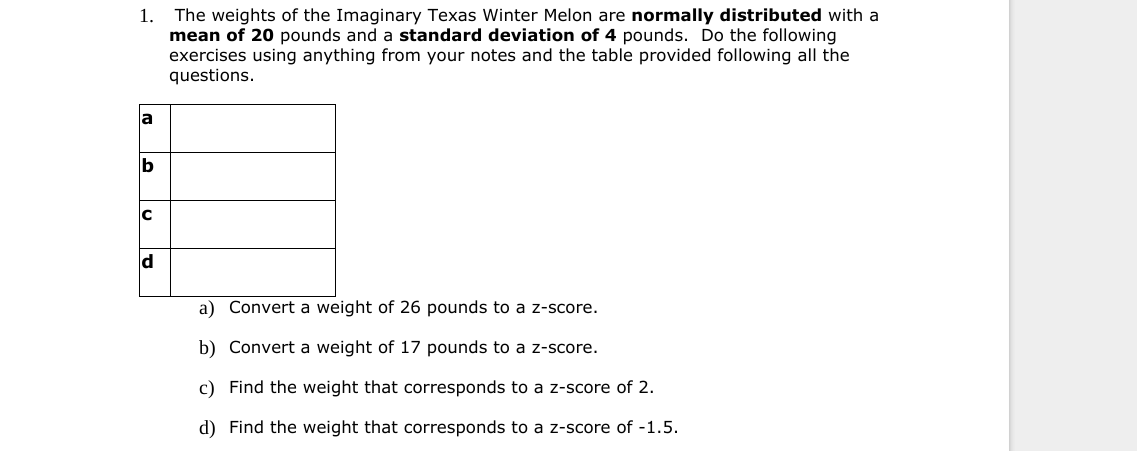
Transcribed Image Text:The weights of the Imaginary Texas Winter Melon are normally distributed with a
mean of 20 pounds and a standard deviation of 4 pounds. Do the following
exercises using anything from your notes and the table provided following all the
questions
1.
a
C
a) Convert a weight of 26 pounds to a z-score.
b) Convert a weight of 17 pounds to a z-score.
c) Find the weight that corresponds to a z-score of 2.
d) Find the weight that corresponds to a z-score of -1.5.
Expert Solution
This question has been solved!
Explore an expertly crafted, step-by-step solution for a thorough understanding of key concepts.
This is a popular solution
Trending nowThis is a popular solution!
Step by stepSolved in 3 steps with 2 images

Knowledge Booster
Similar questions
- Kathy is a business administration major at Florida State University. She is comparing her performanceon her recent midterm exams. Kathy scored an 82 on her accounting exam and an 88 on her managementexam.The mean and standard deviations of the two exams are shown in the table below Course Mean Standard deviation Accounting 70 10 Management 90 4 a. What is the z-score on the Accounting exam? b. What is the z-score on the Management exam? c. On which of the exams did Kathy perform RELATIVELY better? EXPLAIN.arrow_forwardPlease solve using Rarrow_forwardA recent Nielsen analysis found that the typical U.S. smartphone user is spending an average of 220 minutes per day using apps. We speculate that the average time spent using apps for Generation X smartphone users (aged 41-56 years) is less than the national average. The hypotheses are Ho: H = 220 minutes versus Ha: µ < 220 minutes. Summary results from R are provided. Summary Statistics Std. Dev (s) Mean Sample Size (n) 205 minutes 63.25 minutes 31arrow_forward
- Solve this for mearrow_forwardA statistics professor finds that he can predict a student's grade on the final exam based on the number of classes the student attended over the course of the semester. What is the casual relationship between these two variables? a. Students who do well on exams are going to come to class because they enjoy the material. b. We cannot say anything definitive about the casual relationships, as all three of these explanations are possible. c. The relationship likely is the result of some third variable which accounts for both a student's attendance in class and his or her performance on the exam. d. Attendence in classes causes students to understand the material and do well on the exams.arrow_forwardPlease type the solutionarrow_forward
- Solve this question for me please.arrow_forwardNathan takes the State Aptitude Assessment, which has a mean of 350 and a standard deviation of 50. His brother Kyle takes the Regional Readiness Test, which has a mean of 300 and a standard deviation of 45. If Kyle's score was 375, what is the cooresponding z score? a. +2.22 b. +1.00 c. +1.67 d. -1.67arrow_forwardBelow are the summary statistics calculated from the heights of students on a university campus. 25% percent of the students were ________ inches or taller. Median: 68 inches Minimum: 50 inches Q1: 58 inches Q3: 71 inches A. 71 B. 68 C. 58 D. Cannot be determinedarrow_forward
- With the extra data value, the range, standard deviation, and variance is?arrow_forwardWhich of these statistics BEST describes the relationship in this scatterplot? Group of answer choices r = –.45 r = .50 r = –1.00 r = .10arrow_forwardEach of the 5 cats in a pet store was weighed. Here are their weights (in pounds). 13, 12, 5, 12, 9 Find the median and mean weights of these cats. If necessary, round your answers to the nearest tenth. (a) Median: pounds X Ś ? (b) Mean: poundsarrow_forward
arrow_back_ios
SEE MORE QUESTIONS
arrow_forward_ios
Recommended textbooks for you
 MATLAB: An Introduction with ApplicationsStatisticsISBN:9781119256830Author:Amos GilatPublisher:John Wiley & Sons Inc
 Probability and Statistics for Engineering and th...StatisticsISBN:9781305251809Author:Jay L. DevorePublisher:Cengage Learning
 Statistics for The Behavioral Sciences (MindTap C...StatisticsISBN:9781305504912Author:Frederick J Gravetter, Larry B. WallnauPublisher:Cengage Learning
 Elementary Statistics: Picturing the World (7th E...StatisticsISBN:9780134683416Author:Ron Larson, Betsy FarberPublisher:PEARSON
 The Basic Practice of StatisticsStatisticsISBN:9781319042578Author:David S. Moore, William I. Notz, Michael A. FlignerPublisher:W. H. Freeman
 Introduction to the Practice of StatisticsStatisticsISBN:9781319013387Author:David S. Moore, George P. McCabe, Bruce A. CraigPublisher:W. H. Freeman

MATLAB: An Introduction with Applications
Statistics
ISBN:9781119256830
Author:Amos Gilat
Publisher:John Wiley & Sons Inc

Probability and Statistics for Engineering and th...
Statistics
ISBN:9781305251809
Author:Jay L. Devore
Publisher:Cengage Learning

Statistics for The Behavioral Sciences (MindTap C...
Statistics
ISBN:9781305504912
Author:Frederick J Gravetter, Larry B. Wallnau
Publisher:Cengage Learning

Elementary Statistics: Picturing the World (7th E...
Statistics
ISBN:9780134683416
Author:Ron Larson, Betsy Farber
Publisher:PEARSON

The Basic Practice of Statistics
Statistics
ISBN:9781319042578
Author:David S. Moore, William I. Notz, Michael A. Fligner
Publisher:W. H. Freeman

Introduction to the Practice of Statistics
Statistics
ISBN:9781319013387
Author:David S. Moore, George P. McCabe, Bruce A. Craig
Publisher:W. H. Freeman