MATLAB: An Introduction with Applications
6th Edition
ISBN: 9781119256830
Author: Amos Gilat
Publisher: John Wiley & Sons Inc
expand_more
expand_more
format_list_bulleted
Question
thumb_up100%

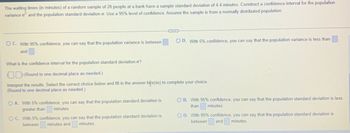
Transcribed Image Text:The waiting times (in minutes) of a random sample of 20 people at a bank have a sample standard deviation of 4.4 minutes. Construct a confidence interval for the population
variance o² and the population standard deviation o. Use a 95% level of confidence. Assume the sample is from a normally distributed population.
OC. With 95% confidence, you can say that the population variance is between
and
O A. With 5% confidence, you can say that the population standard deviation is
greater than
minutes.
COX
What is the confidence interval for the population standard deviation o?
(Round to one decimal place as needed.)
Interpret the results. Select the correct choice below and fill in the answer box(es) to complete your choice.
(Round to one decimal place as needed.)
OC. With 5% confidence, you can say that the population standard deviation is
between minutes and minutes.
O D. With 5% confidence, you can say that the population variance is less than
OB. With 95% confidence, you can say that the population standard deviation is less
than
minutes.
OD. With 95% confidence, you can say that the population standard deviation is
between and minutes.

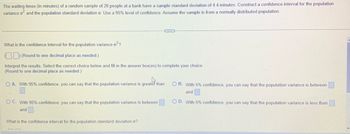
Transcribed Image Text:The waiting times (in minutes) of a random sample of 20 people at a bank have a sample standard deviation of 4.4 minutes. Construct a confidence interval for the population
variance of and the population standard deviation o. Use a 95% level of confidence. Assume the sample is from a normally distributed population.
What is the confidence interval for the population variance o²?
(Round to one decimal place as needed.)
Interpret the results. Select the correct choice below and fill in the answer box(es) to complete your choice.
(Round to one decimal place as needed.)
O A. With 95% confidence, you can say that the population variance is greater than
OC. With 95% confidence, you can say that the population variance is between
and
What is the confidence interval for the population standard deviation o?
OB. With 5% confidence, you can say that the population variance is between
and
O D. With 5% confidence, you can say that the population variance is less than
Expert Solution
This question has been solved!
Explore an expertly crafted, step-by-step solution for a thorough understanding of key concepts.
This is a popular solution
Trending nowThis is a popular solution!
Step by stepSolved in 3 steps with 2 images

Knowledge Booster
Similar questions
- If a researcher wants to determine if one sample mean significantly differs from a population mean and she uses the standard deviation of the sample to estimate the standard deviation of the population, what statistic would she use? Group of answer choices z-test one sample t-test independent t-test dependent t-testarrow_forwardDetermine the critical values for the confidence interval for the population variance from the given values. Round your answers to three decimal places. n = 22 and a = 0.02.arrow_forwardSuppose that you want to perform a hypothesis test for a population mean. Assume that the population standard deviation is unknown and that the sample size is relatively small. In each exercise, we have given the distribution shape of the variable under consideration. Decide whether you would use the t-test, the Wilcoxon signed-rank test, or neither. Explain your answers. Normalarrow_forward
- Calculate the mean of the data, and then calculate the deviations for each of the 6 scores. Using that information, calculate the variance and standard deviation of the data set, and then calculate a Z-Score for each of the 6 scores in the data set. 6, 10, 9, 13, 14, 11arrow_forwardYou are given the smaple mean and the population m standard deviation. Use this info to construct the 90% and 95% confidence intervals for the population mean. Interpert the results and compare the widths of the confidence intervals. A random sample of 50 home theater systems has a mean price of $145. Assume the population standard deviation is $17.30arrow_forwardFind the 95% confidence interval for the population mean if the sample is × = 70.4 and the sample size is n = 24. Assume that the population is normally distributed and the sample standard deviation is 0 = 5. Left Left: Right:arrow_forward
- Use z scores to compare the given values. The tallest living man at one time had a height of 256cm. The shortest living man at that time had a height of 114.6 cm. Heights of men at that time had a mean of 174.87 cm and a standard deviation of 7.57 cm. Which of these two men had the height that was more extreme? Since the z score for the tallest man is z=____ and the z score for the shortest man is z=_____, the (Shortest/tallest) man had the height that was more extreme. (Round to two decimal places.)arrow_forwardA variable of a population has a normal distribution. Suppose that you want to find a confidence interval for the population mean. a. If you know the population standard deviation, which procedure would you use?b. If you do not know the population standard deviation, which procedure would you use?arrow_forwardTina catches a 14-pound bass. She does not know the population mean or standard deviation. So she takes a sample of five friends and they say the last bass they caught was 9, 12, 13, 10, and 10 pounds. Find the t and calculate a 95% (α = .05) confidence interval.arrow_forward
- Determine whether the statement is true or false. If it is false, rewrite it as a true statement. As the size of a sample increases, the standard deviation of the distribution of sample means increases. Choose the correct choice below. C OA. This statement is false. A true statement is, "As the size of a sample increases, the standard deviation of the distribution of sample means decreases." OB. This statement is true. OC. This statement is false. A true statement is, "As the size of a sample decreases, the standard deviation of the distribution of sample means decreases." OD. This statement is false. A true statement is, "As the size of a sample increases, the standard deviation of the distribution of sample means does not change." Time Remaining: 01:26:37arrow_forwardAssume that the two samples are independent simple random samples selected from normally distributed populations. Do not assume that the population standard deviations are equal. Refer to the accompanying data set. Use a 0.05 significance level to test the claim that women and men have the same mean diastolic blood pressure. a. The test statistic is (Round to two decimal places as needed.) b. The P-value is (Round to three decimal places as needed.)arrow_forwardCalcium levels in people are normally distributed with a mean of 9.7 mgdL and a standard deviation of 0.5 mgdL . Individuals with calcium levels in the bottom 10% of the population are considered to have low calcium levels. Find the calcium level that is the borderline between low calcium levels and those not considered low. Carry your intermediate computations to at least four decimal places. Round your answer to one decimal place.arrow_forward
arrow_back_ios
arrow_forward_ios
Recommended textbooks for you
 MATLAB: An Introduction with ApplicationsStatisticsISBN:9781119256830Author:Amos GilatPublisher:John Wiley & Sons Inc
 Probability and Statistics for Engineering and th...StatisticsISBN:9781305251809Author:Jay L. DevorePublisher:Cengage Learning
 Statistics for The Behavioral Sciences (MindTap C...StatisticsISBN:9781305504912Author:Frederick J Gravetter, Larry B. WallnauPublisher:Cengage Learning
 Elementary Statistics: Picturing the World (7th E...StatisticsISBN:9780134683416Author:Ron Larson, Betsy FarberPublisher:PEARSON
 The Basic Practice of StatisticsStatisticsISBN:9781319042578Author:David S. Moore, William I. Notz, Michael A. FlignerPublisher:W. H. Freeman
 Introduction to the Practice of StatisticsStatisticsISBN:9781319013387Author:David S. Moore, George P. McCabe, Bruce A. CraigPublisher:W. H. Freeman

MATLAB: An Introduction with Applications
Statistics
ISBN:9781119256830
Author:Amos Gilat
Publisher:John Wiley & Sons Inc

Probability and Statistics for Engineering and th...
Statistics
ISBN:9781305251809
Author:Jay L. Devore
Publisher:Cengage Learning

Statistics for The Behavioral Sciences (MindTap C...
Statistics
ISBN:9781305504912
Author:Frederick J Gravetter, Larry B. Wallnau
Publisher:Cengage Learning

Elementary Statistics: Picturing the World (7th E...
Statistics
ISBN:9780134683416
Author:Ron Larson, Betsy Farber
Publisher:PEARSON

The Basic Practice of Statistics
Statistics
ISBN:9781319042578
Author:David S. Moore, William I. Notz, Michael A. Fligner
Publisher:W. H. Freeman

Introduction to the Practice of Statistics
Statistics
ISBN:9781319013387
Author:David S. Moore, George P. McCabe, Bruce A. Craig
Publisher:W. H. Freeman