MATLAB: An Introduction with Applications
6th Edition
ISBN: 9781119256830
Author: Amos Gilat
Publisher: John Wiley & Sons Inc
expand_more
expand_more
format_list_bulleted
Question
thumb_up100%

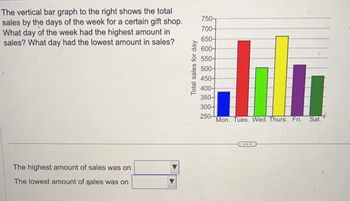
Transcribed Image Text:The image features instructions and a vertical bar graph titled "Total sales for day." The text reads:
"The vertical bar graph to the right shows the total sales by the days of the week for a certain gift shop. What day of the week had the highest amount in sales? What day had the lowest amount in sales?"
Below this, there are two dropdown questions:
1. "The highest amount of sales was on __________."
2. "The lowest amount of sales was on __________."
### Bar Graph Details:
- **Y-Axis (Vertical):** Represents "Total sales for day," ranging from 250 to 750.
- **X-Axis (Horizontal):** Days of the week: Mon., Tues., Wed., Thurs., Fri., Sat.
- **Bars:**
- **Monday:** Blue, approx. 300
- **Tuesday:** Red, approx. 650
- **Wednesday:** Green, approx. 500
- **Thursday:** Yellow, approx. 700
- **Friday:** Purple, approx. 550
- **Saturday:** Green, approx. 450
### Analysis:
- **Highest Sales:** Thursday (approx. 700)
- **Lowest Sales:** Monday (approx. 300)
Expert Solution
This question has been solved!
Explore an expertly crafted, step-by-step solution for a thorough understanding of key concepts.
This is a popular solution
Trending nowThis is a popular solution!
Step by stepSolved in 2 steps

Knowledge Booster
Similar questions
- An employee receives $20 in commission on sales amounting to $500. What is the employee's commission rate in this situation?arrow_forwardAn assortment of coins contains 14 pennies, 16 nickels, 9 dimes, and 11 quarters. To three significant figures, calculate the percentage of coins that have a face value of $0.05 or less.arrow_forwardAccording to a certain central bank from 2000 to 2016 the average price of a new home in a certain region increased by 53% to $402,000. What was the average price of a new home in 2000?arrow_forward
- In 14 weeks, the value of Bob Treatman's day trading account decreased by $588. What was the average weekly change in the value of the account? .... A. $40 per week O B. - $44 per week O C. - $42 per week O D. - $48 per weekarrow_forwardSuppose that you have bought a total of 3200 shares of a stock of a particular company. You bought 1400 shares of stock at $17 per share 700 shares of stock at $12 per share and the remaining shares at $22 per share. What is the average price you paid per share of stock?arrow_forwardif boat originally cost 8,632.39, but the sell price is 6,400.00 what percentage of sell price is marked downarrow_forward
- A corporation reported profits of approximately $2,000 million with approximately $50,400 million in revenues. Compare the profit to revenue by writing as a fraction in lowest termarrow_forwardThe starting salary for an RN at Midwest Hospital is $62,287. If a nurse receives a 3% raise each year, what will an RN at Midwest Hospital make in her fifth year? Be sure to round to the nearest cent.arrow_forwardMasis's bank charges $8.95 for up to 10 transactions per month, plus 75 cents for each additional transaction. In Sept., he made 7 transactions, in Oct., he made 21 transactions, and in Nov., 14 transactions were made. Determine the LARGEST amount of service charge deducted from his account among those three months in comparison.arrow_forward
arrow_back_ios
arrow_forward_ios
Recommended textbooks for you
 MATLAB: An Introduction with ApplicationsStatisticsISBN:9781119256830Author:Amos GilatPublisher:John Wiley & Sons Inc
 Probability and Statistics for Engineering and th...StatisticsISBN:9781305251809Author:Jay L. DevorePublisher:Cengage Learning
 Statistics for The Behavioral Sciences (MindTap C...StatisticsISBN:9781305504912Author:Frederick J Gravetter, Larry B. WallnauPublisher:Cengage Learning
 Elementary Statistics: Picturing the World (7th E...StatisticsISBN:9780134683416Author:Ron Larson, Betsy FarberPublisher:PEARSON
 The Basic Practice of StatisticsStatisticsISBN:9781319042578Author:David S. Moore, William I. Notz, Michael A. FlignerPublisher:W. H. Freeman
 Introduction to the Practice of StatisticsStatisticsISBN:9781319013387Author:David S. Moore, George P. McCabe, Bruce A. CraigPublisher:W. H. Freeman

MATLAB: An Introduction with Applications
Statistics
ISBN:9781119256830
Author:Amos Gilat
Publisher:John Wiley & Sons Inc

Probability and Statistics for Engineering and th...
Statistics
ISBN:9781305251809
Author:Jay L. Devore
Publisher:Cengage Learning

Statistics for The Behavioral Sciences (MindTap C...
Statistics
ISBN:9781305504912
Author:Frederick J Gravetter, Larry B. Wallnau
Publisher:Cengage Learning

Elementary Statistics: Picturing the World (7th E...
Statistics
ISBN:9780134683416
Author:Ron Larson, Betsy Farber
Publisher:PEARSON

The Basic Practice of Statistics
Statistics
ISBN:9781319042578
Author:David S. Moore, William I. Notz, Michael A. Fligner
Publisher:W. H. Freeman

Introduction to the Practice of Statistics
Statistics
ISBN:9781319013387
Author:David S. Moore, George P. McCabe, Bruce A. Craig
Publisher:W. H. Freeman